


Stock Market Choppy Uptrend May Have Topped
Stock-Markets / Stock Markets 2015 May 30, 2015 - 12:20 PM GMTBy: Tony_Caldaro

 Another choppy week, but biased to the downside. The market started the holiday shortened week at SPX 2126. After a gap down opening on Tuesday the market dropped to SPX 2099. It rallied right back on Wednesday to close the gap, hitting SPX 2126. Then it worked its way lower for the rest of the week to close at SPX 2107. For the week the SPX/DOW lost 1.05%, the NDX/NAZ lost 0.40%, and the DJ World index lost 1.4%. On the economic front it was another mixed week. On the uptick: new/pending home sales, consumer confidence/sentiment, and the FHFA housing index. On the downtick: durable goods orders, Q1 GDP, the Chicago PMI, the WLEI, and weekly jobless claims increased. Next week’s highlights are Payrolls, the FED’s Beige book, ISM and the PCE.
LONG TERM: bull market
The SPX just completed its seventh month trading within a 162 point range: 1973-2135. During this period there have been two downtrends and two uptrends, with the second uptrend still underway. One has to go back to 2012 to see such a narrow point range in this bull market. When that year was done, the year that followed, 2013, was one of the best of the entire six year bull market. For now, however, it looks like the market needs one more downtrend before it can start generating those types of returns again.
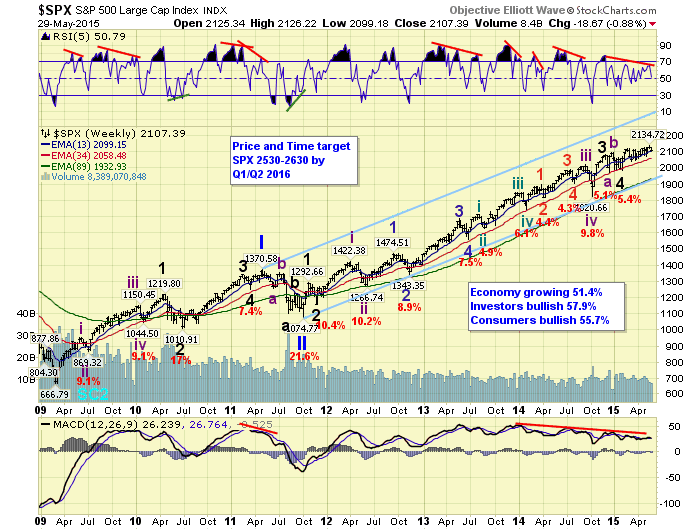
The long term count remains the same. A six year Cycle [1] bull market which will probably last eight years. Two Primary waves completed in 2011, and Primary III still underway from the October 2011 low. Major waves 1, 2, 3 and 4 completed with Major wave 5 underway. We are still expecting Major wave 5 to subdivide into five Intermediate waves into 2016. Currently the market is still in Intermediate wave i.
MEDIUM TERM: uptrend may be rolling over
For the past three months this market has been a day traders dream. It has spent three months within a 95 point trading range: mostly drifting to the upside with several larger pullbacks along the way. From an Elliott Wave perspective it has been somewhat of a nightmare. Every rally starting impulsive then ending corrective. As we have noted many times in the past. We do not look for triangles, either leading, ending or corrective to unfold, until they become obvious. The current leading diagonal triangle has been obvious for at least a month. We have been offering that count on the SPX daily chart.
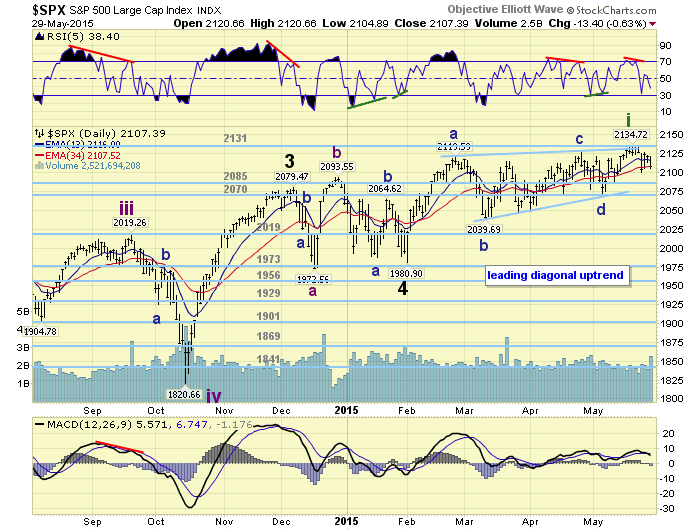
Last weekend we posted the market had reached an inflection point. There was a potential choppy impulse pattern unfolding, if the market broke out to the upside. We posted it on the hourly chart. This week the market did not break out, it declined. We now feel that count can be discarded since the rally from the May low at SPX 2068 also looks corrective. So with the leading diagonal triangle for Intermediate wave i now looking complete, we reviewed the charts looking for any negative supporting evidence. We found quite a bit.
We had been noting that the monthly RSI was displaying a negative divergence, and the MACD had turned negative. In addition to that the weekly RSI/MACD are displaying negative divergences. Now we can add a negative RSI divergence on the daily SPX, NAZ and NDX charts. In addition, the R2K and NYAD (market breadth) have joined the HGX and TRAN in confirmed downtrends. On the international front. Of the eight Asian markets we track only China and Japan are still in uptrends. In Europe, the only market in an uptrend, of the eight we track, is oddly Greece. It appears, if ones government is not buying stocks or tapping out their credit, your market is in a downtrend.
When the downtrend does get confirmed we expect it to find support at the low SPX 2040’s or worse case the 2019 pivot. A 61.8% retracement of the entire uptrend occurs at SPX 2040. Once that occurs we would then expect a new uptrend, Intermediate wave iii, to take the market impulsively to new highs. Medium term support is at the 2085 and 2070 pivots, with resistance at the 2131 and 2198 pivots. It is interesting how the OEW 2131 pivot range (2124-2138) has halted this uptrend twice in the past four weeks.
SHORT TERM
As noted above, we offered the option of this choppy uptrend turning impulsive if the rally from SPX 2068 made new highs. On Tuesday the market immediately overlapped the potential impulse waves making the entire rally corrective yet again. As a result we see the leading diagonal triangle scenario as clearly the most obvious and probable count.
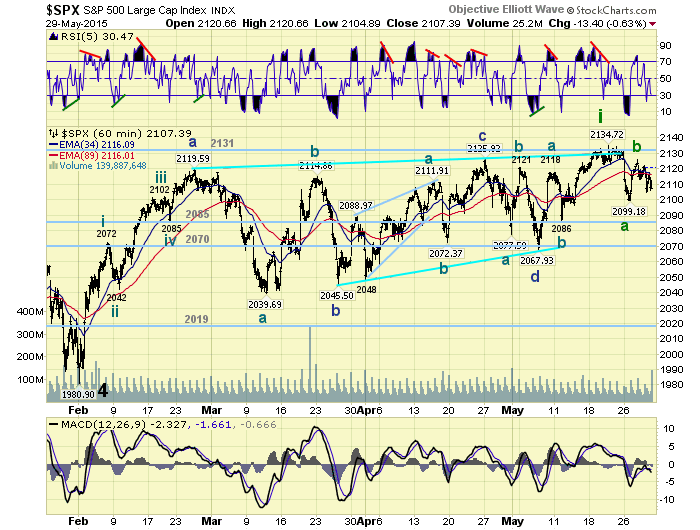
From the expected uptrend high at SPX 2135 we can count an ‘a’ down to SPX 2099, then a ‘b’ wave rally to 2126, followed by a ‘c’ wave underway to 2005 so far. We can not be sure about the wave degree until we see more market activity. Short term support is now at SPX 2096/99 and the 2085 pivot, with resistance at SPX 2117/22 and the 2131 pivot. Short term momentum ended the week nearing oversold. Best to your trading!
FOREIGN MARKETS
The Asian markets were mostly lower on the week for a net lost of 0.7%.
The Europeans markets were all lower on the week for a net loss of 2.0%.
The Commodity equity group were all lower for a net loss of 3.8%.
The DJ World index has yet to confirm a downtrend but lost 1.4% on the week.
COMMODITIES
Bonds appear to be uptrending and gained 0.7% on the week.
Crude is uptrending and gained 0.5% on the week.
Gold appears to be downtrending and lost 1.3% on the week.
The USD appears to be uptrending and gained 0.9% on the week.
NEXT WEEK
Monday: Personal income/spending and PCE prices at 8:30, a speech from FED vice chair Fischer at 9:30, then ISM manufacturing and Construction spending at 10am. Tuesday: Factory orders, a speech from FED governor Brainard, and Auto sales. Wednesday: the ECB meets in Frankfurt, the ADP index, the Trade deficit, ISM services, and the FED’s Beige book. Thursday: weekly Jobless claims. Friday: Payrolls (est. +230k) and Consumer credit. A busy week. Enjoy your weekend!
CHARTS: http://stockcharts.com/public/1269446/tenpp
After about 40 years of investing in the markets one learns that the markets are constantly changing, not only in price, but in what drives the markets. In the 1960s, the Nifty Fifty were the leaders of the stock market. In the 1970s, stock selection using Technical Analysis was important, as the market stayed with a trading range for the entire decade. In the 1980s, the market finally broke out of it doldrums, as the DOW broke through 1100 in 1982, and launched the greatest bull market on record.
Sharing is an important aspect of a life. Over 100 people have joined our group, from all walks of life, covering twenty three countries across the globe. It's been the most fun I have ever had in the market. Sharing uncommon knowledge, with investors. In hope of aiding them in finding their financial independence.
Copyright © 2015 Tony Caldaro - All Rights Reserved Disclaimer: The above is a matter of opinion provided for general information purposes only and is not intended as investment advice. Information and analysis above are derived from sources and utilising methods believed to be reliable, but we cannot accept responsibility for any losses you may incur as a result of this analysis. Individuals should consult with their personal financial advisors.
Tony Caldaro Archive |
© 2005-2022 http://www.MarketOracle.co.uk - The Market Oracle is a FREE Daily Financial Markets Analysis & Forecasting online publication.