Options Pricing - Covert Gamma, Portfolio Insurance, and STDs
InvestorEducation / Options & Warrants May 30, 2015 - 06:31 AM GMTBy: John_Mauldin
 By Jared Dillian
This piece requires some knowledge of option pricing, so I’m going to bring everyone up to speed.
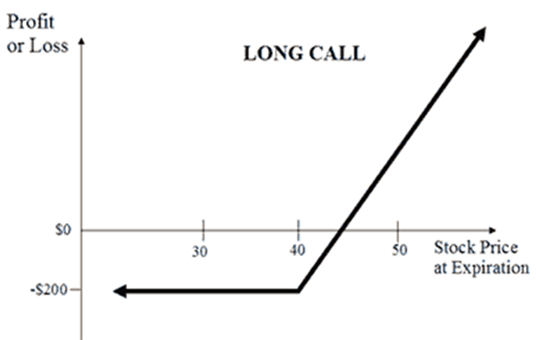
This is the P&L diagram of a long call option:

Source: theoptionsguide.com
As you can see, there is a premium paid for the option. If the underlying asset rises above the strike price, the profit available to the option holder is unlimited. Above the strike price, the option essentially behaves like stock (a $1 change in the stock price results in a $1 change in the option price). Below the strike price, the option behaves like nothing at all.
But this is actually the P&L diagram of the option at expiration.
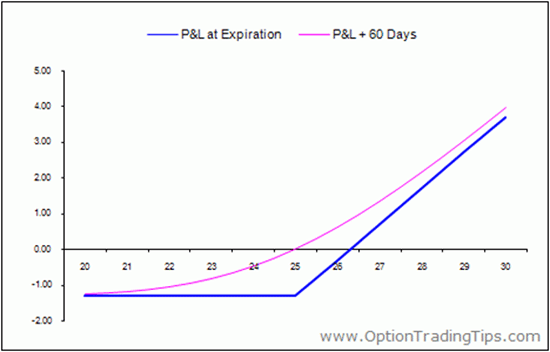
The P&L diagram of the option today looks like this:

Source: optiontradingtips.com
The red line is where we are today. Notice that the line is smooth, not the “hockey stick” shape the option has at expiration. At $25 in the chart above, the stock has about an equal chance of finishing in the money or out of the money.
The slope of the red line is about 0.5. We would call this a “50 delta” option—meaning that the stock has a 50% chance of finishing in the money. It’s actually a partial derivative.
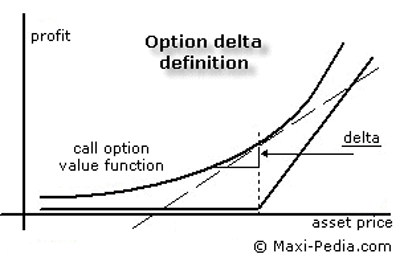
We call this the “delta.” It’s defined as the change in the price of the option for a given change in the price of the stock, as shown below.

Source: maxi-pedia.com
The delta is super important to option market makers. They typically hedge the “delta” of the option with stock so as to remain “delta neutral” (for reasons that are a little too complex for this discussion). If the market maker has a portfolio of options and the underlying asset moves, he will have to re-hedge his delta.
Why? Because the delta itself changes due to gamma. The delta is the first derivative of the change in option price due to the change in the stock. The gamma is the second derivative. It is the curvature of that red line above.
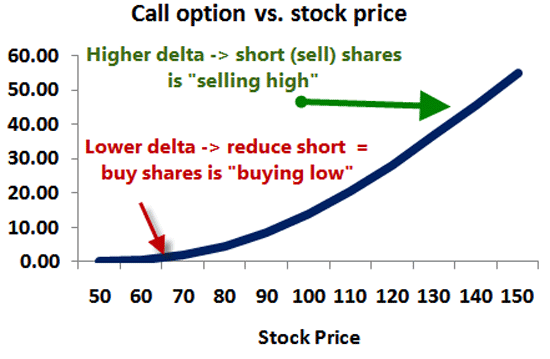
If I am long an option and I hedge the delta, if the stock goes up, I am going to get longer delta, and I will need to sell stock. If the stock goes down, I will get shorter delta, and I will need to buy stock, as shown below.

Source: Bionicturtle.com
Buying low and selling high is good, right? In this example, someone who is hedging a long option is said to be long volatility. If the asset moves around more than he thought it would, he makes money. This is called being long gamma.
The opposite is true with respect to being short options. Through delta hedging, you’re forced to buy when the market goes higher and sell when the market goes lower, so you want the market to move as little as possible. This is called being short gamma, and leads us to our next topic.
Portfolio Insurance
Most people know that something called “portfolio insurance” is blamed for the Crash of 1987, but they don’t really know what it is.
Basically, it was a hedging technique marketed to asset managers that allowed them to limit their losses and participate in the upside. Say you were a mutual fund—basically, you would pretend you had a portfolio of short options, and you would hedge this invisible gamma by selling when the market went down and buying when the market went up.
Pretty ingenious, right? Except, like a lot of things in capital markets, portfolio insurance might work fine if one person does it, but not if everyone does it.
So on that day in October 1987, when the market started going lower, the portfolio insurance programs kicked in, and waves of sell orders hit the market, which triggered more portfolio insurance programs, etc.
I actually like to call this “Covert Gamma.” There was a lot of short gamma out there in the market, but you would never know by looking at the open interest of index options. It was hiding.
Covert Gamma
It is sort of an old equity derivatives parlor game to try to figure out if the Street is long or short gamma, and by how much. Generally the Street is short gamma, because customers tend to be net buyers of options. That means volatility generally is exacerbated, with dealers selling on the way down and buying on the way up.
But sometimes it is worse than others.
I like to think about covert gamma a lot. Like, for the past few years, when everyone has been making jokes about BTD. Buy The Dip. Sometimes they say BTFD, but that is impolite.
So if buyers come in every time the market goes down 5%, the market is really long gamma, right? It’s covert gamma, but it’s still gamma.
And maybe they sell if the market goes up a few percent, further suppressing volatility.
I think we’ve had a lot of volatility suppression in the last six years, principally from the Fed. The Fed has done a lot of things to suppress volatility (QE, ZIRP) and many people, including myself, think that if you keep suppressing volatility, it is going to come out someday, in a big way, and that will lead to even more volatility.
STD
That’s when Buy The Dip turns into Sell The Dip. It’s funny—nobody ever talks about when we cross over into Sell The Dip. It happens. This is a psychological construct, and you can’t measure it. But at some point, people will get sufficiently spooked (by whatever) that they don’t stand there and bid with both hands. They grab a can of peaches and head for the hills.
Well, let me just say this: When things are quiet, that’s when people start putting on portfolio insurance-like structures that require everyone to sell at once.
It’s human nature. People want to protect gains, so they put on stop losses (covert short gamma) or maybe even structured equity derivatives that take them out of the trade if the market goes down x. These are short gamma trades.
In its most basic form, it’s market psychology. I know a few smug longs on Twitter who constantly berate the bears. I don’t know what they’re thinking—probably that they’ll be able to get out if the market goes down 5% or 10%. The liquidity might not be there when they need it.
The very important conclusion here is: I think at any point in the last six years, the market has never been short more covert gamma, and I think tail risk is very high. I am not bearish, per se. But I think the probability that we will get some sort of market dislocation is too high to ignore.
I generally don’t buy tail risk protection, because I think it is overpriced and usually a waste of money. But I will be buying it soon—whether it’s SPX puts, VIX call spreads, VXX calls, or put spreads in HYG, I am going to make sure I’m covered.
I’m not scared. Think of it as putting on a seatbelt. Take it from the guy who usually rides around without one.
Final Note: Bull’s Eye Investor
So as you probably have figured out by now, I’m also the editor of Bull’s Eye Investor here at Mauldin Economics. I started about eight or nine months ago.
One of the things I’ve been able to do in that newsletter is to dig really deep into topics. It’s about 20-25 pages long, which allows me to research stuff in much more depth than I can for The 10th Man. The piece on the Canadian housing bubble I did a couple of months ago was a pretty good example, and the one on European interest rates last month was a super deep-dive.
Obviously, I think some of the investment ideas are great, but win or lose, I have always focused on the process. I spend a lot of time thinking about how I’m thinking—call it meta-cognition, and if the thought process is sound, the profits will follow.
But maybe a particular issue of Bull’s Eye Investor gives you more ideas or sends you in a different direction—also good. If you can’t find some way to make money with it, you’re probably holding it upside down.
Along the way, we get to talk about some pretty neat stuff (and funny stuff, too). Lots of great brain food. If you like to think big and dream bigger, this is probably for you. And if you don’t like it, there’s always our 90-day money-back guarantee.
I sure hope you will join me.
Jared Dillian
John Mauldin Archive |
© 2005-2022 http://www.MarketOracle.co.uk - The Market Oracle is a FREE Daily Financial Markets Analysis & Forecasting online publication.


