


Crude Oil Dynamic Price Action Technical Analysis over the last 9 months
InvestorEducation / Elliott Wave Theory Mar 12, 2007 - 12:26 AM GMTBy: Joseph_Russo

After a wild ride from last years July top, what lies ahead for Crude Oil prices?
We'll get to the bottom of that rather “deep well” in our last price chart and closing comments. First, let's back up and take a look at what's happened to the price of Crude Oil from the near $80.00 spike high back in July of ‘06. This will give us a sense of price history, and will also reveal just how Elliott Wave Technology has been making clients HUGE PROFITS ever since . From July 13, 2006 through March 2, 2007 , position traders' using our analysis could have made a minimum of $38,000.00 per oil contract!
From Elliott Wave Technology's Near Term Outlook July, 2006
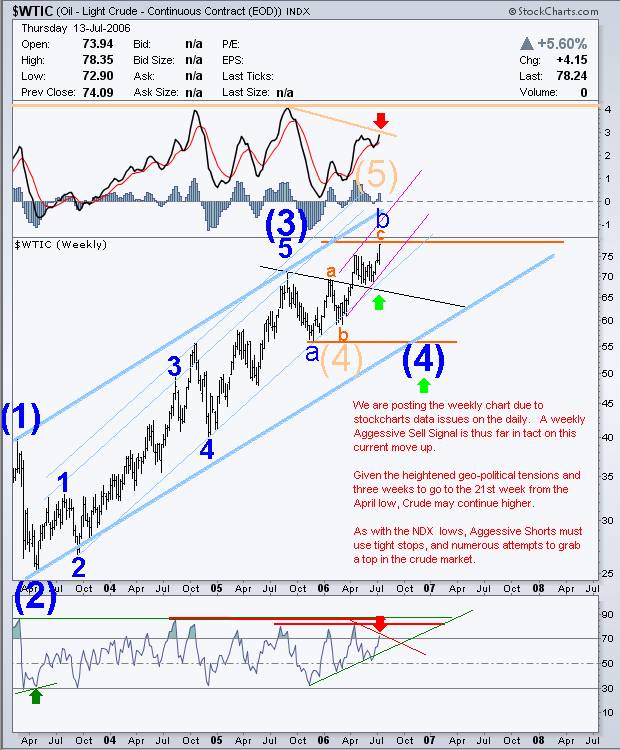
July 13, 2006 : Impartial Warnings for Investors, Position, Swing, and Short-Term Traders:
The longer-term weekly chart above shows our preferred wave count for crude oil. The alternate count (tan) portrays crude nearing a top of much greater significance. Our preferred (4) down was positioned near the 55.00 level and scheduled to arrive somewhere in late 2006. Given the maturity of the advance, sell signals were beginning to surface and we had advised our clients to get defensive. Of added interest is our chart notation referring to our concurrent and similar anticipation for a July '06 key pivot bottom in the NDX.
From Elliott Wave Technology's Near Term Outlook July, 2006
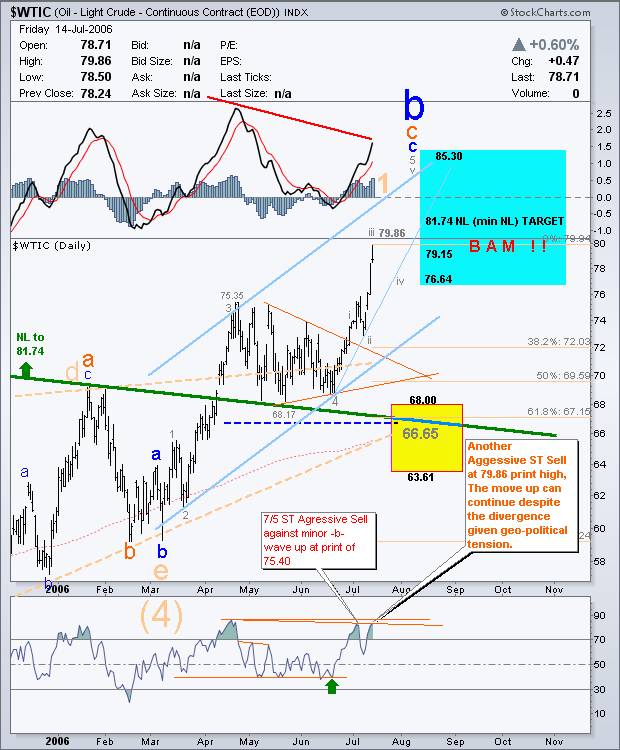
July 14, 2006; a SELL ALERT is ISSUED for Investors, Position, Swing, and Short-Term Traders:
In the following update, daily charts were back, and with them came a secondary sell signal for all time horizons. Note that our wave count contingency calling for a move above 80.00 failed to materialize. It is important to point out, that such contingencies do not drive our guidance. As impartial analysts, we care only that our guidance and forecasting are accurate. Although Elliott Wave Theory is an essential part of our discipline, under no circumstance does it ever take precedence over the cumulative aspects of our broad market analysis. For position traders getting an early jump in reversing to the short side of the market, an earlier sell signal against the 75.40 level on July 5 was stopped-out. Just $4.00 from the eventual top, USO “long only” fund investors took massive profits and stepped out of the way. For shorter-term traders, the July 5 signal was a profitable one. By July 14, we issued a broad based secondary sell signal fading the 79.86 intraday high for all time horizons.
Next, we'll fast forward nearly four months to see what happened through November.
Price Chart from Elliott Wave Technology's Near Term Outlook November 2006
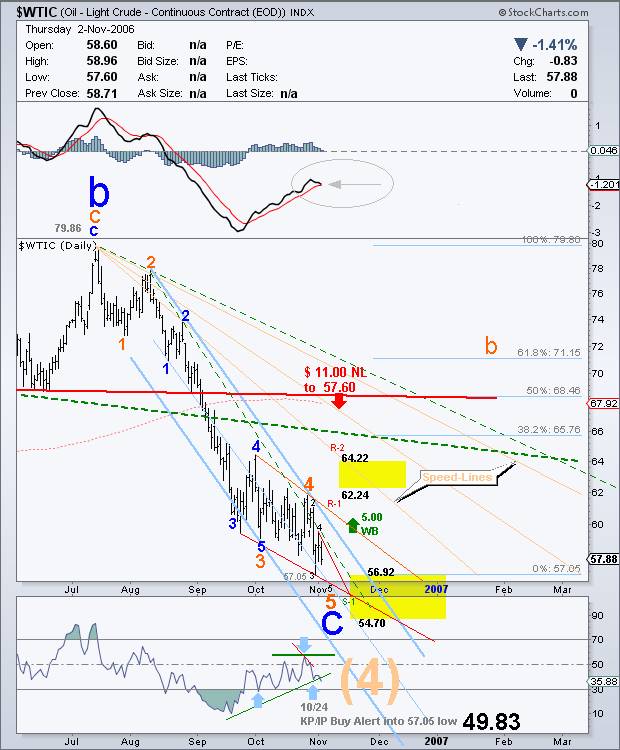
October 24, 2006; a BUY ALERT is Issued for Swing, and Short Term Traders:
Fast forward to Thursday November 2, and you will note that position shorts are deep, deep, in the money by at least $18.00 or $18,000.00 per full size futures contract! Although swing traders were whipsawed on a few early long probes from the early October lows, shorter-term traders did well amid those swings. By October 24, we were on our fourth buy probe against fresh 57.05 lows for shorter duration traders. This one turned out to be an outstanding “money shot” for swing traders.
Next, we'll advance a month in time to see how this shorter duration guidance panned out.
Price Chart from Elliott Wave Technology's Near Term Outlook December 2006
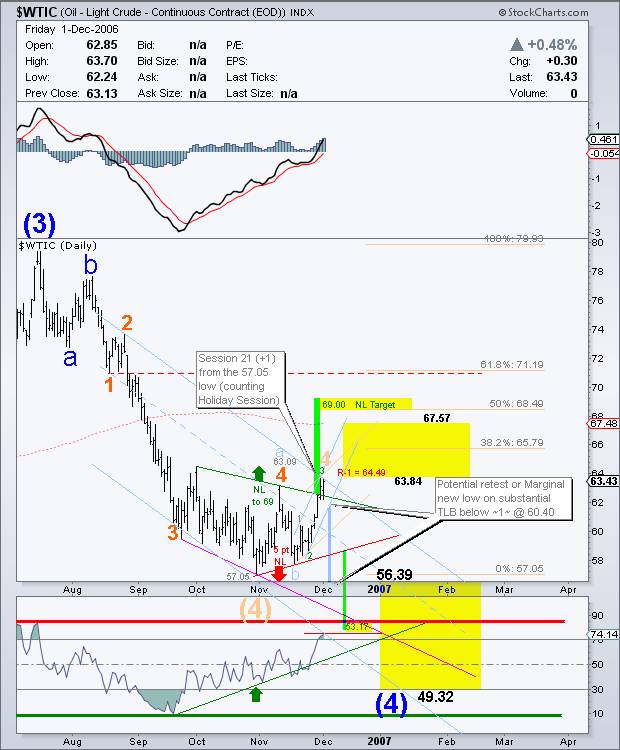
December 1, 2006 ; Impartial Dynamic Navigational Guidance for Swing, and Short-Term Traders:
Fast forward to December 1, after our fourth try in buying a bottom, the October 24 $57.05 low finally stuck! Nearly a month later in early December, we became defensive and warned that a potential retest or marginal new low was plausible. As usual, we had fresh downside contingency targets already in place. The downside capture window opened at 56.39 and closed all the way down to 49.32. Half way down the window rested a pattern target of 53.17. All such targets were very real levels of risk to longs. Conversely, our very fat and happy position traders were all over this in anticipation of adding to their already incredibly profitable short positions!
A good analyst will point out both short and long-term opportunities along with risks you may not have previously considered.
Price Chart from Elliott Wave Technology's Near Term Outlook December 2006
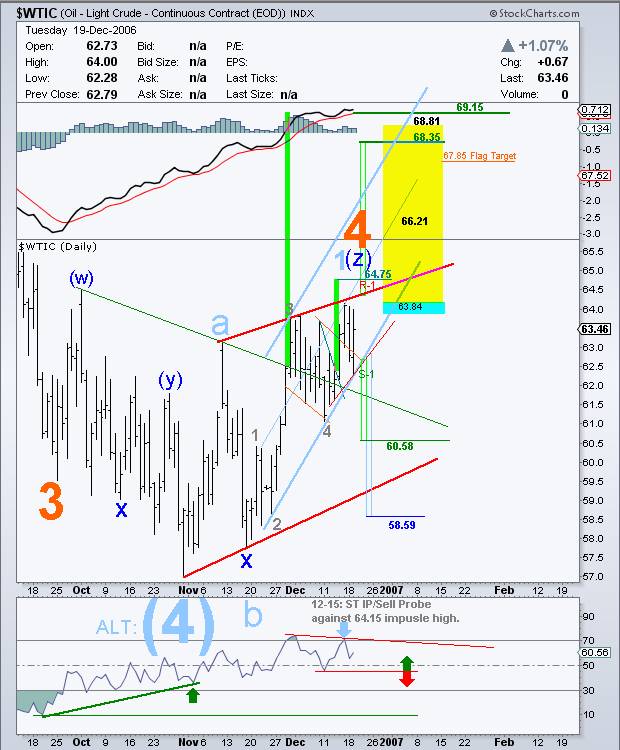
December 15, 2006 ; a SELL ALERT is Issued for Swing and Short-Term Traders:
Two weeks later, after a very bullish run up into Mid-December, we issued a Short Term Interim Pivot sell probe against the 64.15 high. Do take note that this high was IMPULSIVE! Although our alternate count could justify the impulse as 1 of 5 of ‘c' up, our preferred count read this correctly as a wave (z) of ‘4' up terminal.
Concise impartial forecasting provides clear targets and parameters from which to develop highly profitable, low risk trade and investment strategies.
Now we'll fast forward about a month or so, to January of 2007 to see how this guidance delivered.
Price Chart from Elliott Wave Technology's Near Term Outlook January 2007
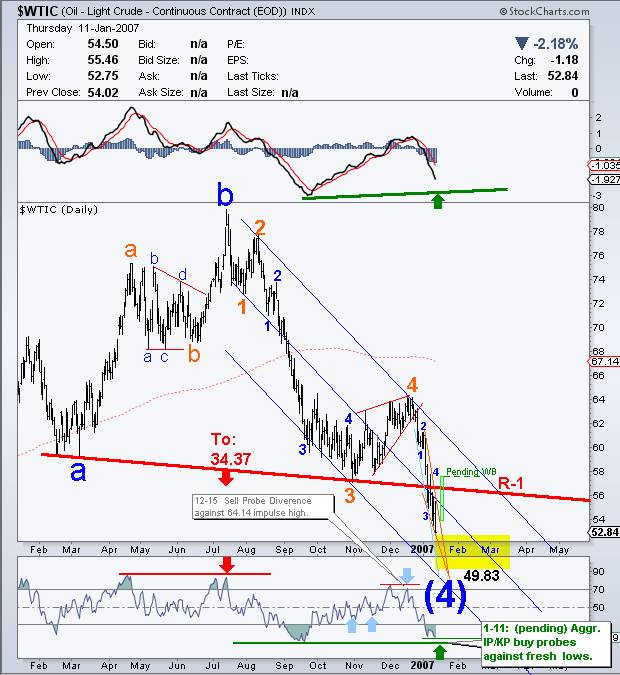
January 11, 2007 ; ADVANCE WARNING for Investors, Position, Swing, and Short-Term Traders:
In less than a month, from the 64.15 ‘4' wave terminal; Crude Oil was spiraling out of control to the downside. A mega bearish neckline had breached, and for very good reason, many were anticipating a move to $35.00 Crude. By January 11, we began issuing advance warning guidance for all time horizons, that aggressive “buy” probes fading the death spiral were imminent.
Free of emotion and desire for specific outcomes, a consistently accurate and impartial forecaster/analyst can provide essential checks and balances against your open or prospective positions.
Price Chart from Elliott Wave Technology's Near Term Outlook January 2007
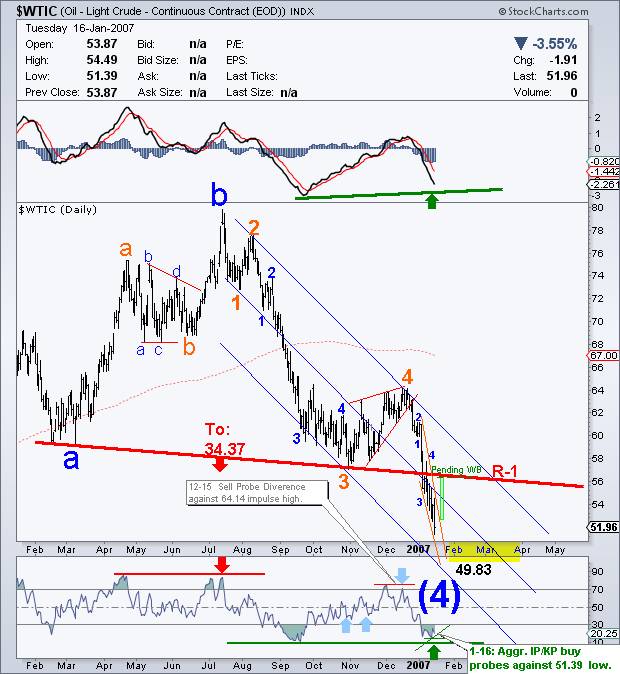
January 16, 2007; a BUY PROBE ALERT is issued for Investors, Position, Swing, and Short-Term Traders:
By January 13, our “buy” probes began in earnest. By January 16, we were now on our third aggressive “buy” probe against the session low of 51.39. Our position traders just got a whole lot fatter and happier! They added at least another $10,000.00 per contract for a total of $28,000 in profits, and that's assuming they did not add to shorts, and simply held one full size contract! We have now guided them back to the long side of the market along with general long-only USO fund investors. We assure you that our short-term traders were biting their nails, pulling their hair out, and worrying dearly about the prospects of $35.00 oil. Our guidance remained steadfast. Long Crude against the 51.39 low.
The moment an analyst acquires financial stake and emotional involvement in a particular trade's outcome, price forecasting becomes tainted and biased . In contrast to accepting blind trade recommendations, traders embracing impartial, adept navigational guidance develop superior trading and investment skills that last a lifetime!
Price Chart from Elliott Wave Technology's Near Term Outlook January 2007
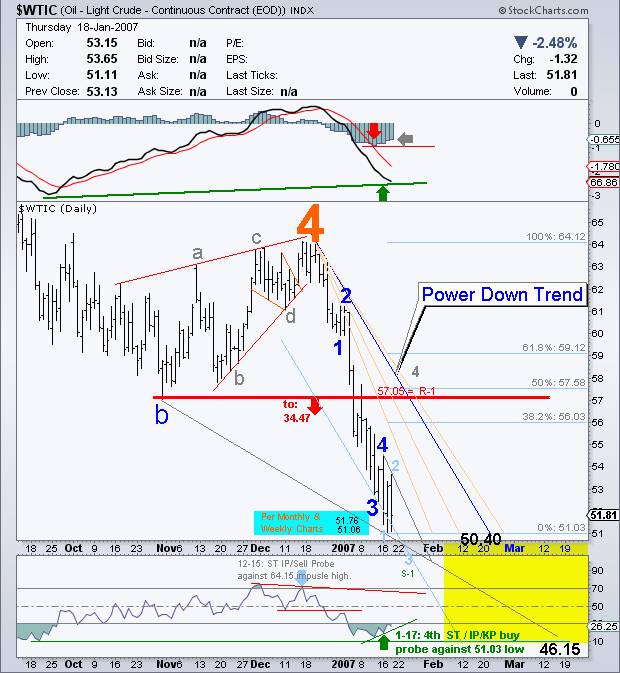
January 17, 2007 ; impartial unwavering guidance to stay with persistent signals in the face of intense emotional adversity:
On January 17, the market printed yet another intraday low! This one was .36 cents below the previous and (you guessed it) prompted us to reiterate our FOURTH buy probe against it! Of added note on the chart are two longer-term downside price targets that we imported from our Monthly and Weekly charts. The resting long-term targets were 51.76, 51.06, and highlighted in blue. The print low on January 17 was 51.03!
We now fast forward to March 2, 2007 . In the next chart below, the measurable benefits in securing impartial forecasting guidance as part of ones trading arsenal becomes abundantly clear. In reversing long, Position traders captured another $10.00 move, widening their profits to an astounding $38,000.00 per contract!
“Impartiality is absolute freedom from emotion. Freedom from emotion fosters clarity.”
Our last follow up chart and closing comments answers the question:
“ What comes next for Crude Oil prices?”
Price Chart from Elliott Wave Technology's Near Term Outlook March 2007
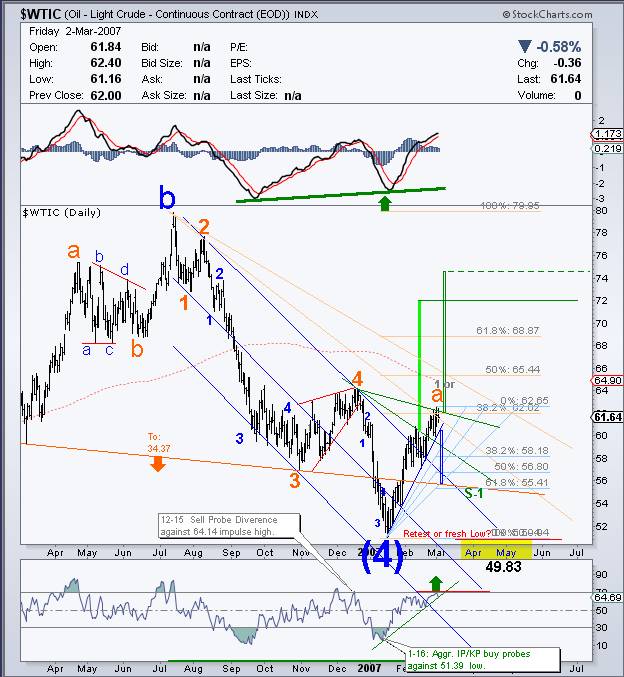
WHAT NEXT…
Hmmm, let's take a look… The Longer-Term Trend remains up. The Intermediate Trend is still down, and, the Short-Term trend is up, but appears to be topping. As of yet, there is no confirmation of a lasting bottom. Price action has been very constructive since the January lows however; the market has reached substantial levels of overbought. Short of a geopolitical event, or major supply disruption, price levels will likely need to consolidate for a time. How and when they do so is critical in determining our ongoing guidance. Our general assessment to date is that a retest or fresh low is still plausible though not very likely.
We are sorry to disappoint, though proud to disclose that we do not predict markets; instead, we take ownership of the dynamic price action as it unfolds, and do so in such a way that no black-box algorithm could possibly match. Doing so impartially, allows us to anticipate direction then formulate astute and unrivaled guidance based on the daily evolution of price. As evidenced in this arresting presentation, the resulting competitive edge is compelling and immeasurable!
By Joseph Russo
Chief Editor and Technical Analyst
Elliott Wave Technology
Copyright © 2007 Elliott Wave Technology. All Rights Reserved.
Joseph Russo, presently the Publisher and Chief Market analyst for Elliott Wave Technology, has been studying Elliott Wave Theory, and the Technical Analysis of Financial Markets since 1991 and currently maintains active member status in the "Market Technicians Association." Joe continues to expand his body of knowledge through the MTA's accredited CMT program.
© 2005-2022 http://www.MarketOracle.co.uk - The Market Oracle is a FREE Daily Financial Markets Analysis & Forecasting online publication.