


Crude Oil Trading Alert - Price Drops to Neck Line
Commodities / Crude Oil May 19, 2015 - 12:28 PM GMTBy: Nadia_Simmons

 Trading position (short-term; our opinion): Short positions with a stop-loss order at $65.23 are justified from the risk/reward perspective.
On Friday, crude oil gained 0.49% as a weaker greenback supported the price. As a result, light crude bounced off the neck line of a bearish formation. Will we see further improvement in the coming days?
On Friday, the Federal Reserve Bank of New York reported that its Empire State manufacturing index rose less-than-expected (to 3.9, missing forecasts for an increase to 5.00). Additionally, the University of Michigan's preliminary reading of the consumer sentiment index for May slipped to 88.6 from a final April reading of 95.9, missing analysts' forecasts for a reading of 96.0. Thanks to these disappointing numbers, the USD Index declined to Thursday's low, making crude oil more attractive for buyers holding other currencies. As a result, light crude bounced off the neck line of a bearish formation, but will we see higher values of the commodity in the coming week? (charts courtesy of http://stockcharts.com).
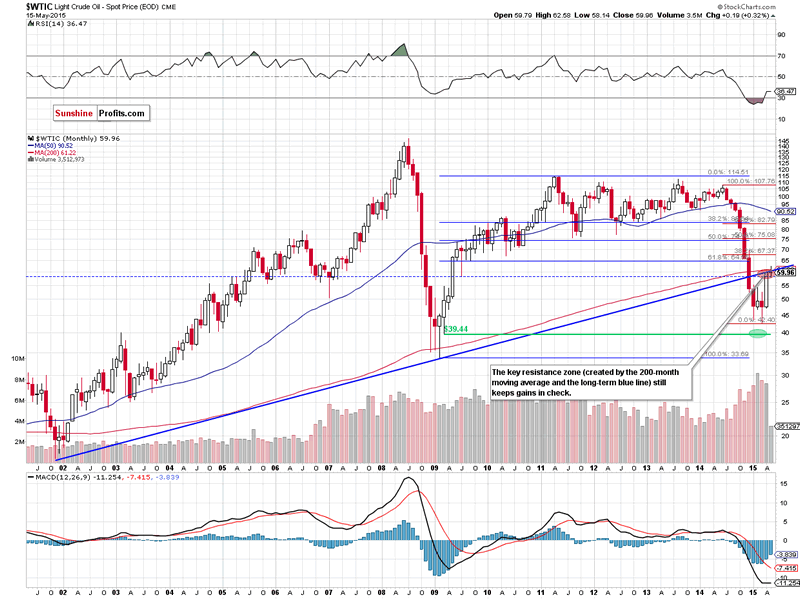
On the long-term chart, we see that Friday's move was too small to be visible (not to mention change anything) from this perspective. As you see crude oil still remains under the key resistance zone (created by the 200-month moving average and the long-term blue line), which means that as long as there is no breakout above this area higher values of the commodity are not likely to be seen and further deterioration is more likely than not.
How Friday's upswing affect the very short-term chart? Let's take a closer look at the chart below and find out.
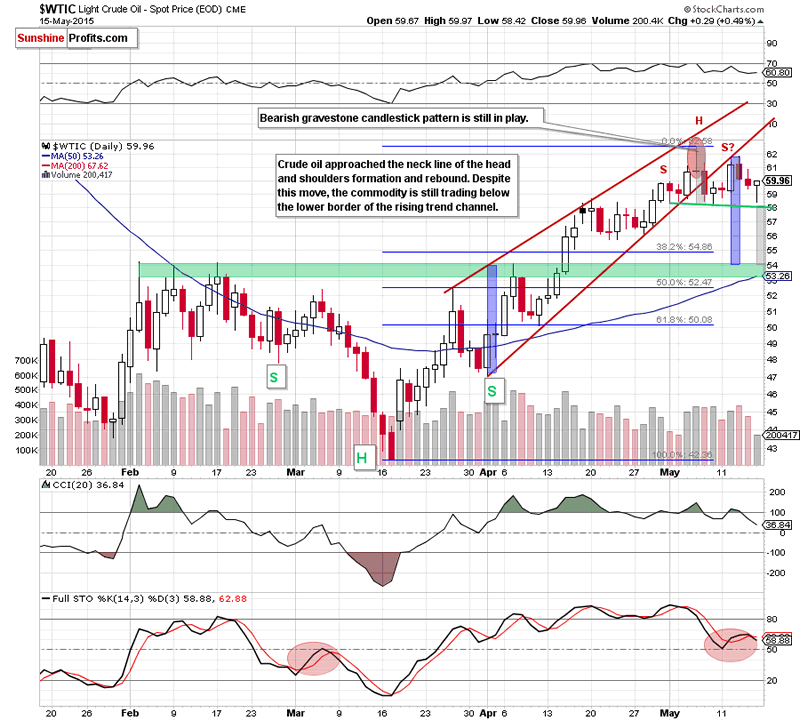
On the daily chart, we see that crude oil extended losses after the market's open and approached the neck line of the head and shoulders formation. The proximity to this important support encouraged oil bulls to act and resulted in a rebound in the following hours. Despite this move, the commodity is still trading well below the recent high and the previously-broken lower border of the rising wedge. Additionally, Friday's upswing materialized on tiny volume, which doesn't confirm oil bulls' strengths. On top of that, the Stochastic Oscillator generated a sell signal, supporting the bearish case. As a reminder, we saw similar position of the indicator at the beginning of March. Back then, a buy signal generated by the indicator triggered a very short-lived upswing, which erased some of earlier drop. Despite this move, the commodity reversed and declined sharply after a sell signal, which suggests that we could see further deterioration in the coming week (especially when we factor in the gravestone candlestick formation and sell signals generated by the RSI and CCI).
Taking all the above into account, we believe that what we wrote in our Oil Trading Alert posted last Tuesday is still up-to-date:
(...) we can notice a potential head and shoulders formation. If this is the case, and oil bears take advantage of this opportunity, light crude will extend declines and test the strength of the green support zone (created by the Feb highs around $54-$54.24) in the coming days (please note that in this area the size of the downswing will correspond to the height of the formation).
Nevertheless, (...) oil bears will have to push the commodity below the green support line based on the May lows (the neck line of the formation is currently around $58.14) before we see an acceleration of the decline.
On top of that, (...) crude oil broke below the lower border of the rising wedge, which suggests a drop to the green support zone created by the Feb highs (in this area the size of the downward move will correspond to the height of the formation).
Summing up, although crude oil bounced off the neck line of a bearish formation, the commodity still remains under the key resistance zone (marked on the monthly chart), which is also reinforced by the recent highs and the lower border of the rising wedge. This suggests that even if light crude moves little higher from here, the space for further gains will be limited and a breakdown below the neck line of the formation is just around the corner.
Very short-term outlook: bearish
Short-term outlook: bearish
MT outlook: mixed with bearish bias
LT outlook: mixed with bearish bias
Trading position (short-term; our opinion): Short positions with a stop-loss order at $65.23 are justified from the risk/reward perspective.
Thank you.
Nadia Simmons
Forex & Oil Trading Strategist
Przemyslaw Radomski
Founder, Editor-in-chief
Sunshine Profits: Gold & Silver, Forex, Bitcoin, Crude Oil & Stocks
Stay updated: sign up for our free mailing list today
* * * * *
Disclaimer
All essays, research and information found above represent analyses and opinions of Nadia Simmons and Sunshine Profits' associates only. As such, it may prove wrong and be a subject to change without notice. Opinions and analyses were based on data available to authors of respective essays at the time of writing. Although the information provided above is based on careful research and sources that are believed to be accurate, Nadia Simmons and his associates do not guarantee the accuracy or thoroughness of the data or information reported. The opinions published above are neither an offer nor a recommendation to purchase or sell any securities. Nadia Simmons is not a Registered Securities Advisor. By reading Nadia Simmons’ reports you fully agree that he will not be held responsible or liable for any decisions you make regarding any information provided in these reports. Investing, trading and speculation in any financial markets may involve high risk of loss. Nadia Simmons, Sunshine Profits' employees and affiliates as well as members of their families may have a short or long position in any securities, including those mentioned in any of the reports or essays, and may make additional purchases and/or sales of those securities without notice.
Nadia Simmons Archive |
© 2005-2022 http://www.MarketOracle.co.uk - The Market Oracle is a FREE Daily Financial Markets Analysis & Forecasting online publication.