UK Election Forecast 2015 - Coalition Economic Recovery vs Labour Collapse
News_Letter / UK General Election May 18, 2015 - 02:40 PM GMTBy: NewsLetter
 The Market Oracle Newsletter April 1st, 2015
Issue # 6 Vol. 9
UK Election Forecast 2015 - Coalition Economic Recovery vs Labour Collapse
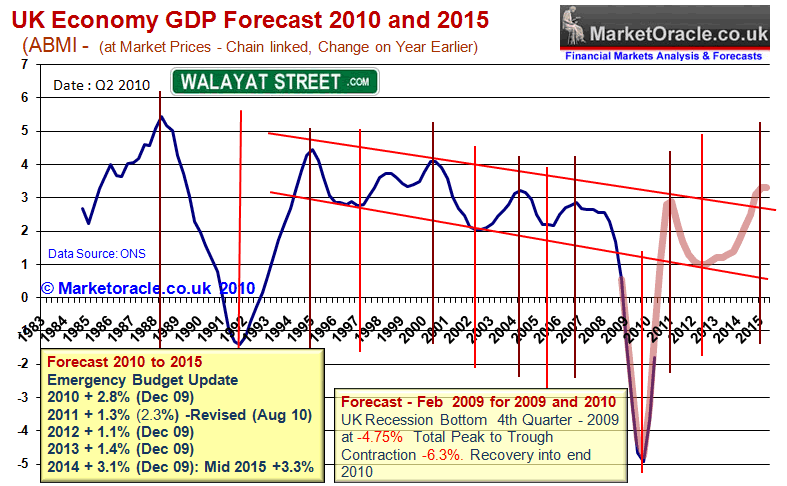
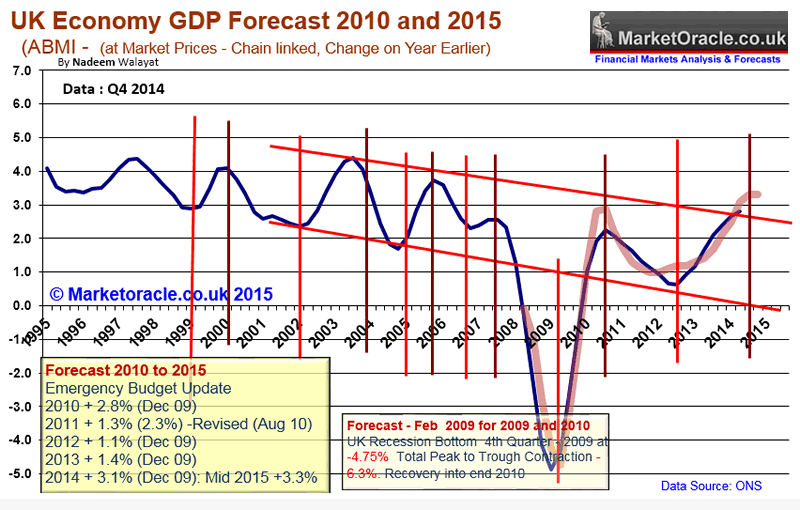
Dear Reader, The last ONS GDP statistics released before election day revised GDP growth higher for 2014 to 2.8% from the previous estimate of 2.6%, against 1.7% for 2013. The UK economy is now growing at its fastest pace since 2006 and leads the G7 countries prompting George Osborne to tweet “GDP revised upwards from 2.6% to 2.8% for 2014. Confirms UK as clearly fastest growing major advanced economy.” Whilst Ed Balls responded “This is the slowest recovery for 100 years and the Tories have failed to deliver the sustained rises in living standards they promised.” Though conveniently forgetting that the economy was recovering from the last Labour governments economic collapse. UK Economy - GDP Growth - Coalition +8.8%, Labour +3.3% My long standing forecast as of Dec 2009 as in the Inflation Mega-trend ebook (FREE DOWNLOAD), 31 Dec 2009 - UK Economy GDP Growth Forecast 2010 and 2011, The Stealth Election Boom ) and the update following the June Emergency Budget revising 2011 to +1.3% (09 Aug 2010 - UK Economy GDP Growth Forecast 2010 to 2015) was for the UK economy to grow by 1.4% for 2013 and 3.1% for 2014 totaling GDP 4.5% against actual of 1.7% and 2.8%, also totaling 4.5%.
The updated GDP graph illustrates that UK GDP during the past 5 years has closely matched my original forecast expectation of December 2009, with my forecast for the next 5 years due to be generated over the next few months.
Coalition Economic Recovery vs Labour Collapse The economy remains the primary voter issue, because without an economy no government can do anything. The above GDP graph illustrates that as forecast the Coalition's economic recovery was one of two halves, first 3 years of austerity to try and get a grip on the nations finances following Labours economic collapse that resulted in an £170 billion annual deficit, followed by 2 years to achieve a debt fuelled election mini economic boom, tweaked to peak during May 2015. The following table better illustrates the comparison of economic growth between Labour and Coalition as the economic collapse of 2008-2009 virtually wiped out the growth of the preceding years of the Labour government that only marginally recovered into Q1 2010 on the back of a £170 billion of unsustainable deficit spending that left Labour with GDP growth over 5 years of just +3.4% and the accumulative quarterly GDP of only 3.3% which illustrates the magnitude of the collapse.
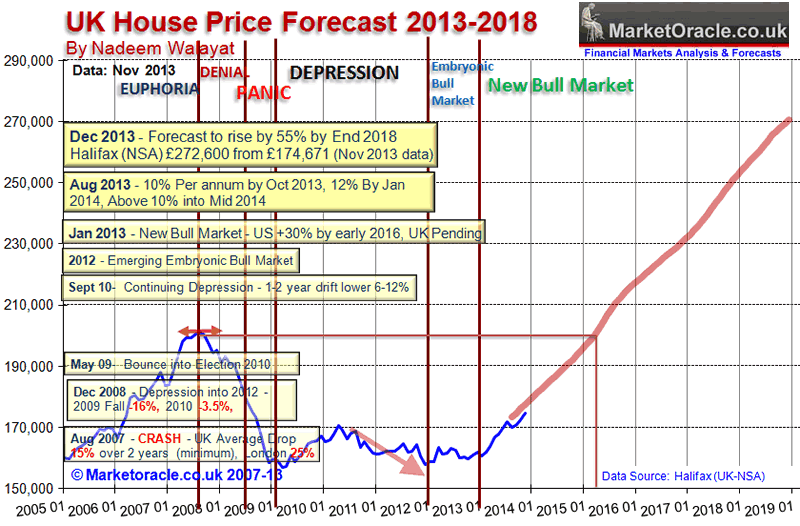
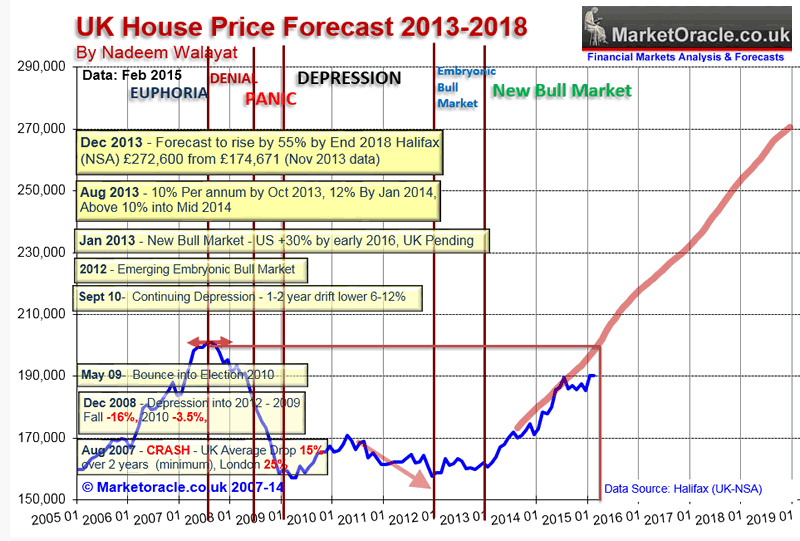
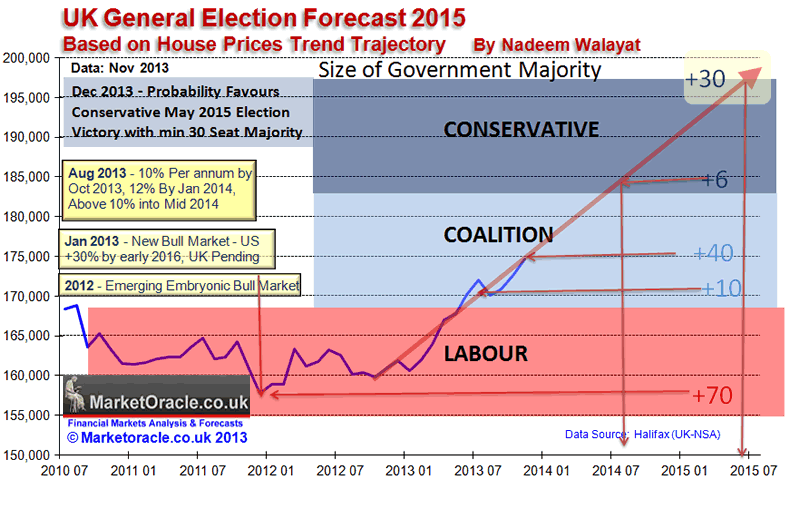
* 2015 Q1 estimated at the same rate as 2014 Q4 Whilst the Conservatives current 2 year economic bounce has overcome the stagnation of their first 3 years to leave GDP 9.5% higher, however accumulative quarterly GDP comes in at a lower +8.8% that reflects just how close the UK came to going back into recession during 2012. Therefore where the economy is concerned, there is NO comparison between the last Labour government and Conservatives in terms of GDP growth as the Coalition achieved near 3X the growth of the last Labour government, this despite attempting to reduce labours out of control budget deficit. UK House Prices Economic Growth Driver For Britain the most critical economic driver, far beyond interest rates, inflation, or even unemployment is the trend in average house prices for the fundamental reason that positive housing market SENTIMENT IS that which makes the all difference between the UK economy being in recession or in an common boom, as you don't tend to get one without the other. Which any government of the day fully realises and why the Coalition government has literally bent over backwards to first ignite and then to target maintaining a house prices bull market right into the May 2015 General Election through a myriad of tax payer funded schemes such as ZERO interest rates, the Help to Buy Scheme, Stamp duty cut and a continuous flood of liquidity forcing savers to spend or invest depreciating value of bank deposits into primarily bricks and mortar as I have covered at length for several years - 19 Aug 2013 - UK House Prices Bull Market Soaring Momentum What Academics and Journalists Will Never Understand About Markets In having immersed by myself in the markets for 30 years now, I know that what many academics tend to take for granted rarely matches reality. Whilst I covered many aspects of trading markets in my last ebook (Stocks Stealth Bull Market 2013 and Beyond - Free Download). However in terms of economic trends what academics will always fail to grasp is that markets are NOT driven by fundamentals but by SENTIMENT and it is SENTIMENT that CREATES the fundamentals! Which is why the academic economists rarely have any real clue as to what is going in the markets because they are nearly always looking in the WRONG direction i.e. they are looking at the CAUSE rather than the EFFECT, as in reality it is the EFFECT that makes itself manifest in the price charts long before the CAUSE appears in the economic data that academics focus upon, which is why the SAME economic data can and is used by economists and pseudo-economist (journalists) such as that which we see on TV news shows to explain EITHER price rises OR falls. You can only know the markets IF you TRADE the markets! The pseudo and academics economists will never get you on the right side of trends years ahead of the herd, in fact most press media commentators will be some of the LAST people to jump onboard trends, usually just before they end! Momentum Drives Housing Market Sentiment and Economic Growth As house price rises continue to accelerate, many people sat on the sidelines waiting for prices to fall or even crash will realise that it is just not going to happen, and in their despair at the relentless accelerating trend of rising prices, in increasing numbers will feel no choice but to jump onboard the housing bull market as a they see the houses they have been viewing sold and asking prices trending ever higher. As house prices rise, home owners see the value of their houses rise £x thousands per month, in many cases by more than their salaries, this will encourage many to borrow and spend more, and save less which will meet the governments primary objective for inflating the economy by means of the housing market. Everyone will be playing the game of how much has my house value increased by, a quick analysis of my own housing portfolio (based in Zoopla estimates) shows a 5.5% increase in housing wealth over just the past 6 months! Does this make me feel richer, more willing to spend? Well, being only human, YES it does! UK House Prices 5 Year Forecast It is now 15 months since excerpted analysis and the concluding 5 year trend forecast from the then forthcoming UK Housing Market ebook was published as excerpted below- UK House Prices Forecast 2014 to 2018 - Conclusion This forecast is based on the non seasonally adjusted Halifax House prices index that I have been tracking for over 25 years. The current house prices index for November 2013 is 174,671, with the starting point for the house prices forecast being my interim forecast as of July 2013 and its existing trend forecast into Mid 2014 of 187,000. Therefore this house prices forecast seeks to extend the existing forecast from Mid 2014 into the end of 2018 i.e. for 5 full years forward. My concluding UK house prices forecast is for the Halifax NSA house prices index to target a trend to an average price of £270,600 by the end of 2018 which represents a 55% price rise on the most recent Halifax house prices data £174,671, that will make the the great bear market of 2008-2009 appear as a mere blip on the charts as the following forecast trend trajectory chart illustrates:
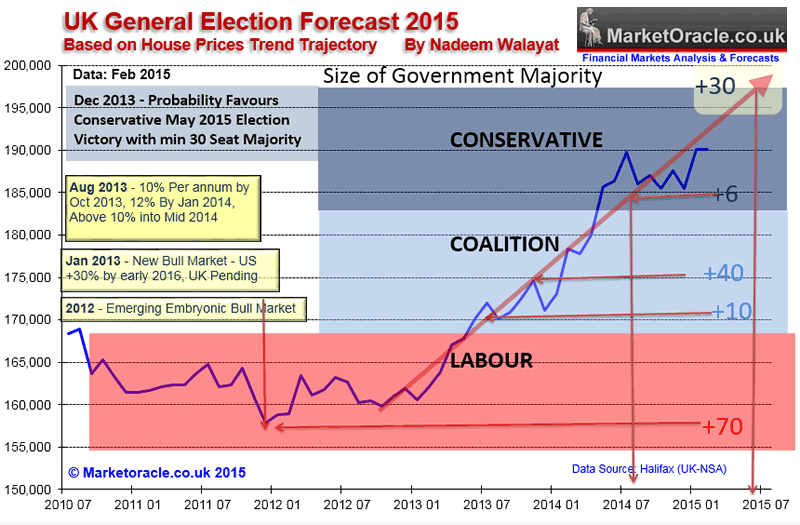
House Prices Labour vs Coalition The financial collapse of 2008-2009 virtually wiped out the whole bull market from May 2005 as I warned right at the very peak of the UK housing market in August 2007 to literally prepare for a house prices crash over the next 2 years that the mainstream financial media remained blind to as they were focused wholly on expectations for a soft landing right upto the point house prices fell over the edge of a cliff some 9 months later in April 2008. 22 Aug 2007 - UK Housing Market Crash of 2007 - 2008 and Steps to Protect Your Wealth UK Housing Market Conclusion:The UK Housing market is expected to decline by at least 15% during the next 2 years. Despite the 2012 Olympics, London is expected to fall as much as 25%. UK Interest rates are either at or very near a peak, as there is an increasingly diminishing chance of a further rise in October 2007. After which UK interest rates should be cut as the UK housing market declines targeting a rate of 5% during the second half of 2008. The implications for this are that the UK economy is heading for sharply lower growth for 2008. What to Do ?1. Home Owners - If you are thinking of selling your home then the time to act is now ! Waiting whilst the credit crunch continues to tighten is a big mistake, especially given the fact that further sharp falls are in the financial markets are just around the corner. 2. Cash - Invest in Fixed Interest Bonds issued by large strong banks , avoid issues from mortgage banks such as Northern Rock. Keep in mind that In the UK savers have protection at 90% of holdings of the first 35k of investments in fixed bonds and savings accounts so bare that limit in mind. Also ensure you have used up your Tax Free ISA allowances. 3. Government Bonds - Invest in Government Bonds, be prepared to hold to maturity so as to reduce risk of market volatility. 4. Government Certificates - Invest in national Savings Certificates such as the and Index Linked Tax Free Certificates, which are an excellent vehicle for higher rate tax payers. 5. A Stock Market Crash or Slump Would be A Buying Opportunity. The stock market is expected to be volatile since we are moving into a new risk climate. Despite a high probability of further sharp falls, and even a crash, there are plenty of long-term plays out there especially in the big cap oil sector. I would also look at bargain hunting metals and mining on further sharp falls or a crash. Similarly for the utilities sectors such as Water. The best plays are probably via investment trusts, of which there are many. I favor investment trusts over unit trusts as they are traded on the stock exchanges exactly as any stock is. Whereas, as I recall in previous financial crisis you may find the phone off the hook on the other end of the line when you try to call to buy or sell unit trust positions. 6. Emerging Markets - I would avoid china, the market is not pricing in risk and is primed for a crash. India and Russia look enticing especially on any sharp falls in sympathy to global market sell offs. Whatever you do, remember that today's Idyllic pleasant picture in the UK is very shortly in for a rude awakening, much as the US home owners are experiencing in increasing numbers. The bull market in housing is over for now, better to realize this now whilst you have the opportunity to do something about it rather than be forced into a decision later on. In terms of the current state of the UK housing bull market, the Halifax average house prices (NSA) data for Feb 2015 of £190,113 basically shows that the UK housing bull market paused from August to December 2014 before resuming its bull run in January. House prices are currently showing a deviation of 4% against the forecast trend trajectory. In terms of the long-term trend forecast for a 55% rise in in average UK house prices by the end of 2018, if the current deviation continued to persist then this would result in an 15% reduction in the forecast outcome to approx a 40% rise by the end of 2018.
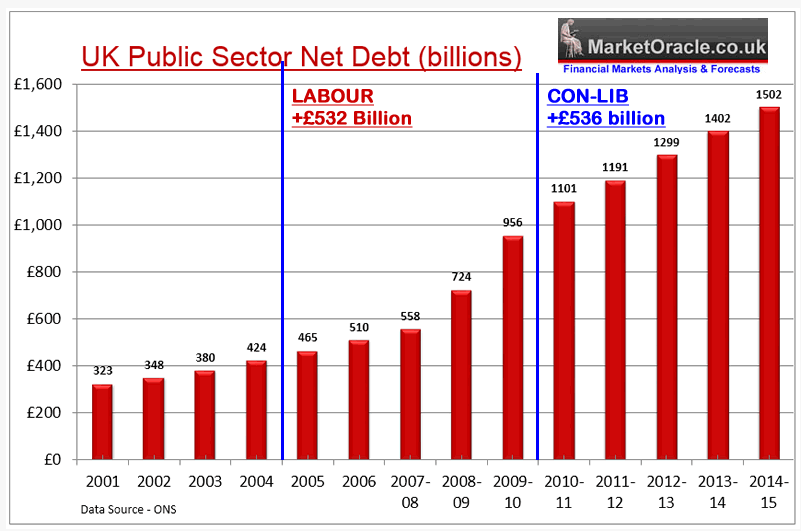
Debt and Deficit - Coalition +£536bn, Labour +£532bn
Jeremy Paxman pointed out that the ConLIb government has borrowed £500 billion, the actual number will be nearer to £550 billion by end of this financial year. Which David Cameron responded to as being a lot less than the previous government. However as the following graph illustrates it is actually more than Labour borrowed during its last 5 year disastrous term in office that left the country on the brink of bankruptcy.
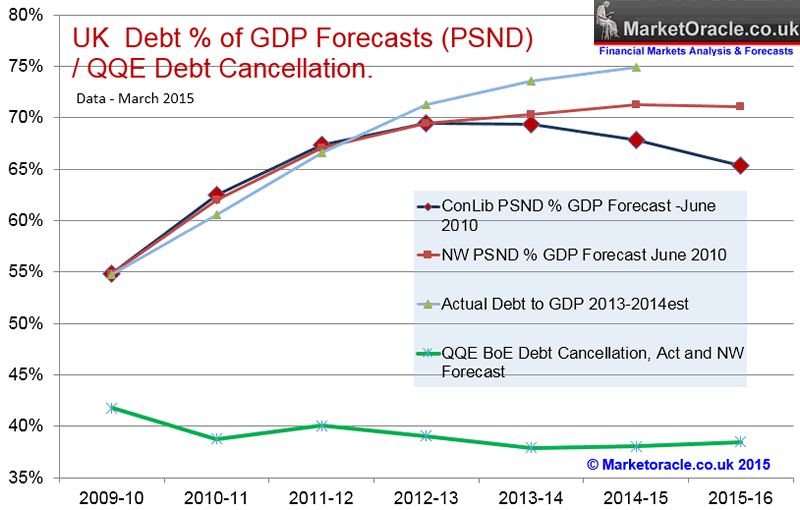
The key point is that the ConLib propaganda of cutting the debt has been just that propaganda with little difference to the amount a Labour government would have borrowed had they been re-elected in May 2010. Again this is a very important point that in terms of deficit and debt the Coalition government has made NO difference to that which a Labour government would have. Instead what we would have seen is more tax rises and spending increases under Labour whilst the Coalition has held taxes and cut real terms spending but both parties would have maintained the deficit. David Cameron also stated that debt as a share of GDP has been falling. However this graph illustrates that there is no such trend on an annual basis with Debt to GDP at 75% for 2014-15 and still rising, which is some 7% above that which ConLib had forecast it would be by now.
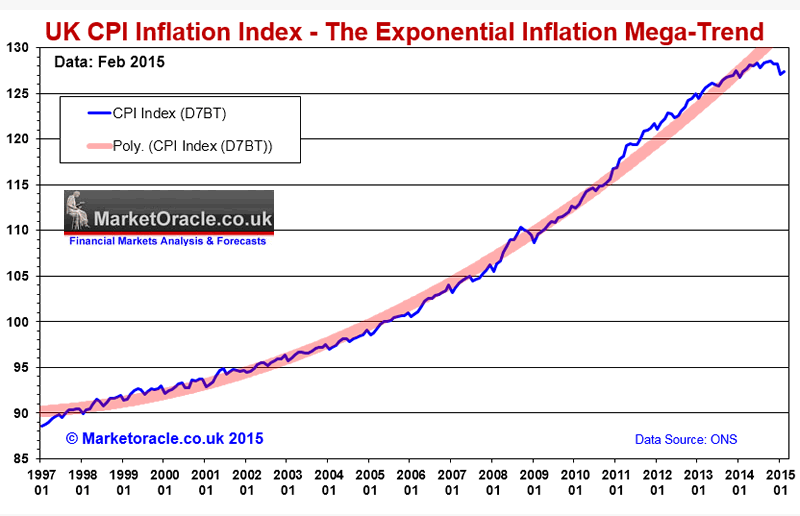
However, the graph also illustrates the effect of what I coined several years ago as the Quantum of Quantitative Easing which is basically the Bank of England printing money to buy 1/3rd of Government debt and then return most of the interest received on these bonds back to the Government which effectively lowers the debt interest burden to 38% of GDP which explains why Britain is not suffering under a 75% of GDP debt regime that without Bank of England money printing would have paralysed the government into inaction euro-zone style as it would have sent interest rates soaring instead the bond market is being heavily manipulated by the Bank of England. 20 Jul 2012 - The Quantum of Quantitative Easing Inflation is Coming! The QQE Secret of How to Print Money Without Increasing Debt The answer to the secret lies in the name, in that we are discussing the QUANTOM of Quantitative Easing. This is taking place right now, completely out of the focus of the public and the mainstream press. QQE is taking place by means of the interest earned on government debt bought by the Bank of England i.e. the Bank of England prints money to buy government debt from the banks, therefore the government pays the Bank of England interest on this debt most of which then gets recycled back to the Government so in effect the government has free money to spend that it should not have, and the more bonds the Bank of England buys the less net interest the Government has to pay. Imagine if all of the bonds were owned by the Bank of England, this would mean that the net interest paid by the government on all of its £1.1 trillion debt would be virtually ZERO! So effectively the government has NO DEBT TO SERVICE, because without any interest to pay it effectively ceases to exist! Yes this mechanism is QQE because it allows the government to spend money without increasing its NET debt burden, not only that but the government is actually REDUCING its debt burden as the debt is actually being cancelled out. So QQE is the quantum of QE as the net debt interest burden falls towards ZERO. I am sure this is one secret that the Bank of England wants to keep hidden away for as long as possible for it implies that the ramping up of the Inflation Mega-trend is already underway with approx 1/3rd of Government debt having been effectively cancelled to date! As effectively 1/3rd of the interest the government pays on it's debts is going back to itself! And meantime about 12% of the value of the debt has been wiped out by inflation (£132 billion) over the past 3.5 years) This is the magic of the electronic money printing presses and inflation, as one minute the government had £1.1 trillion of debt and then the next minute POOF, it is all gone! A bit like Verbal Kint turning into Kaiser Sozer! It is economic magic that the coalition government politicians will pull out of their hat, resulting in no increase in debt and lots of free money to spend or give away in electioneering tax cuts! This is just one mechanism, though probably the primary mechanism but there will be many other schemes that will cooked up between the Treasury and the Bank of England that will fall under the QQE banner. However there is price for printing money in the form of QE and government bonds and that is to cause inflation as the exponential inflation trend illustrates, which makes me laugh when I see academics and journalists panicking over the threat of deflation when the consistent over riding trend is one of exponential inflation as I warned of in my Jan 2010 Inflation Mega-trend Ebook that you can download for free.
Labours Out of Control Deficit Spending - Coalition -£95bn, Labour -£167bn
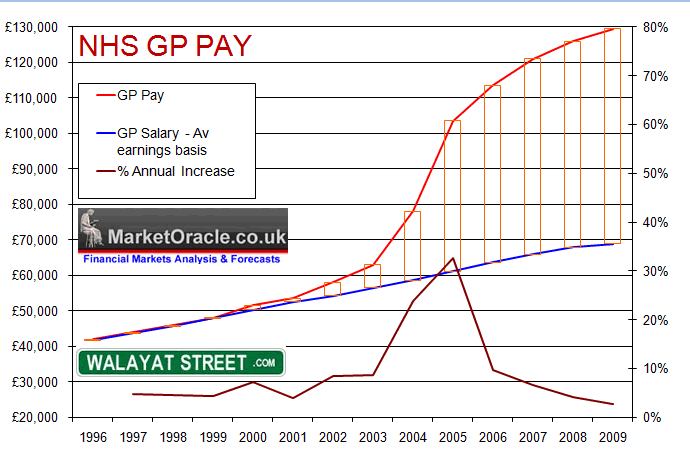
What happened to GP pay is one of the best examples of financial irresponsibility under the last Labour government , as GP pay literally soared into the stratosphere, increasing by as much as 35% per annum far beyond the rate of average earnings that acted as an incentive for GP's to work LESS hours, even abandoning out of hours care of their patients that prompted a huge crisis in the NHS. So Labour's cunning plan for doubling GP pay translated into a baldrick-esk result of far worse GP services.
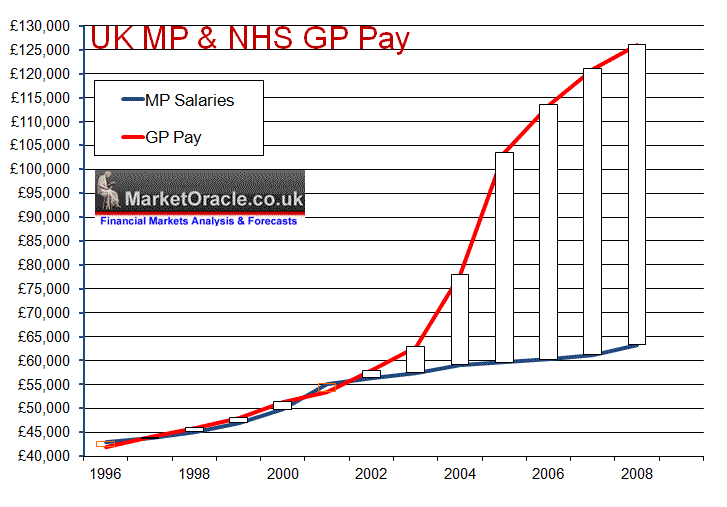
Which in part contributed to the MP expenses scandal as when Labour came to power average MP pay was virtually the same as average NHS GP pay of £44,000 so both were inline with one another at that time. However, as the following graph clearly illustrates that the 2003 GPs contract allowed NHS GP's to award themselves huge pay hikes of over 30% per annum at tax payers expense that has lifted average GP pay to £126,000 per annum against £64,000 for MP's, prompting envious MP's to fiddle their expenses.
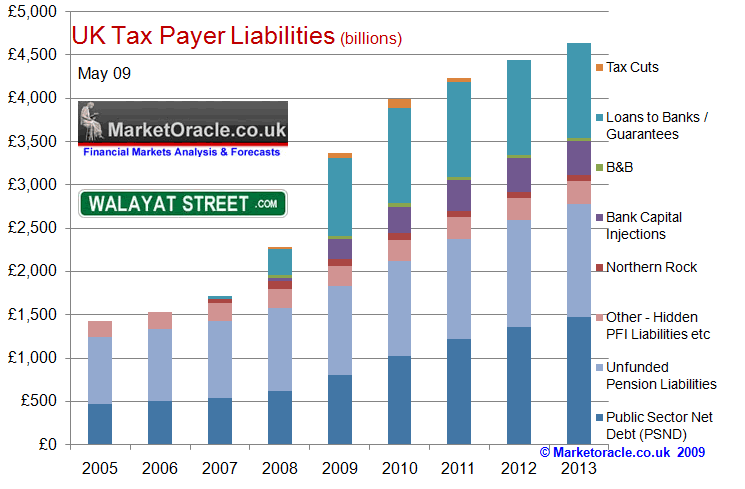
To imagine that a Labour government would cut public spending is delusional because it is just not in Labours DNA to cut public spending as the last Labour government illustrates when the budget deficit literally soared to being out of control and debt, and liabilities were multiplying increasing from £1.4 trillion in 2005 to £4 trillion by May 2010. Labour had literally brought Britain to the brink of financial collapse.
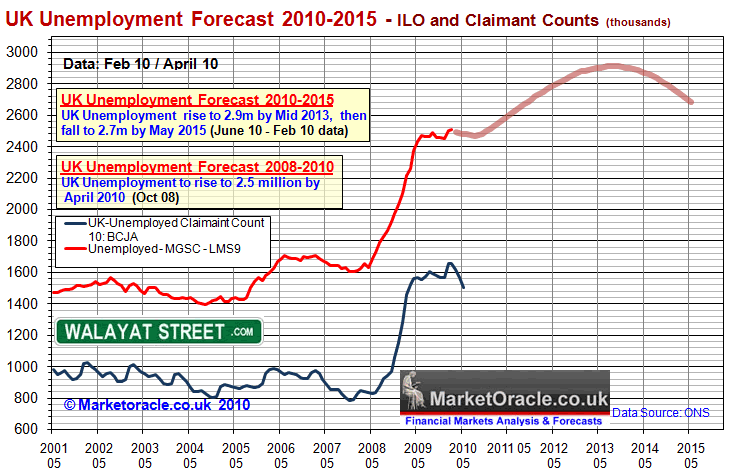
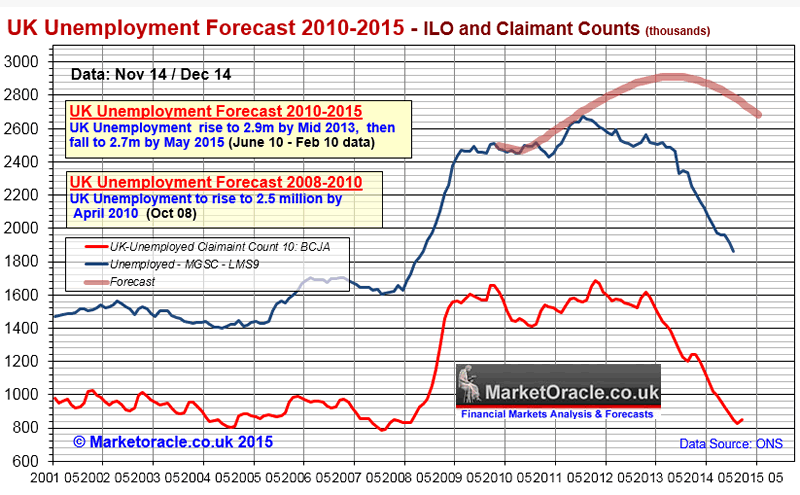
Unemployment - Coalition -700k , Labour +1 million The Conservatives claim much success at having created 1.9 million jobs over the past 5 years and pledge to increase another 2 million jobs over the next 5 years. However approx half of the jobs created have gone to migrant workers. Nevertheless employment has been a huge success for the coalition that translates into UK unemployment falling by 1 million from its 2012 peak of 2.7 million that is set against the early trend trajectory that implied that UK unemployment could rise to 2.9 million by Mid 2013 as illustrated by my long standing forecast below: 01 Jul 2010 - UK Unemployment Forecast 2010 to 2015 Final conclusion - UK unemployment looks set to gradually rise to a peak of just over 2.9 million by mid 2013 before stabilising and starting to decline into a May 2015 General Election of just below 2.7 million against the governments forecast for UK unemployment to fall to 2 million by 2015 (OFBR - Peak at 8.1% this year before falling to 6.1%). The benefit claimant count can also be expected to rise, though is much more difficult to forecast as it is far easier for the government to manage claimant numbers by moving recipients onto other benefits, OFBR forecast a claimant count of 1.17 million by May 2015.
The following updated graph illustrates what has subsequently transpired in that UK unemployment did track my forecast for the first two years before starting to show significant divergence that on face value was a sign of relative economic strength but instead reflects the dual impact of the Coalition government stealthy abandoning the policies of economic austerity as evidenced by expansion of the budget deficit against forecast expectations. Something that both Labour and the Coalition government were happy to under play the significance of as both parties are invested in promoting the impacts of economic austerity. That and the trend for falling wages which encouraged employers to retain / employ workers on significantly less pay.
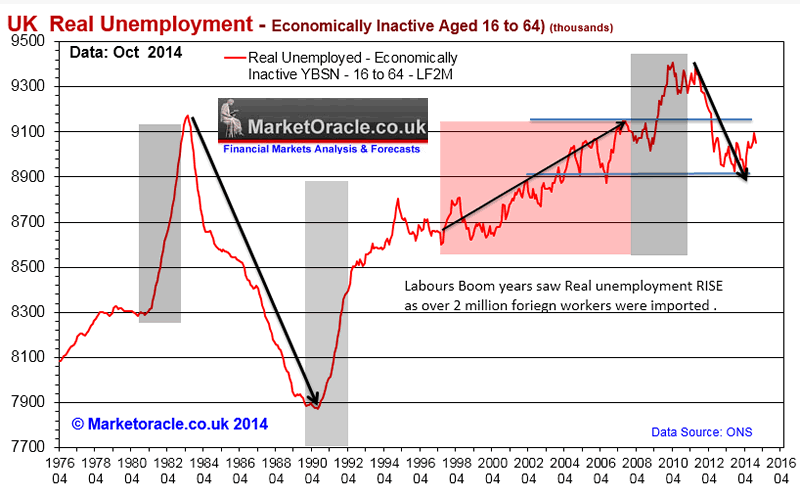
The positive UK unemployment trend has been encouraged through a whole host of schemes such as the Bank of England's funding for lending scheme primarily for small businesses, full time workers converted to part time workers, and 1.1 million more self employed than there were in 2008, and that more than 1.2 million workers are now contracted under zero hours (up from 150,000 in 2010) that amount to a pools of virtual slave labour, workers who tend not to know if they will be working the following day until they receive a phone all or more usually the case a text message the evening before, and even then may find themselves rejected on arrival at work if the quota for workers has been fulfilled for that days shift work, or that their shift will end early on completion of the order, hence less pay as workers are only paid for hours actually worked. Still there is no comparison to Labour's economic collapse that saw unemployment soar by nearly 1 million in just over a year. Real Unemployment is 5.5 Million Whilst the headline UK Unemployment rate peak of 2.7 million at 8.5% of the workforce is remarkably low when one compares it against past milder recessions had seen UK unemployment peak at much higher levels i.e. in the 1980's at 12% and in 1990 at 10.8%, therefore on face value the Labour government and then Coalition appeared to have achieved a minor miracle by UK unemployment peaking at only 8.5% amidst the worst recession since the Great Depression, which in reality was an 6 year economic depression. However, I have long questioned the accuracy and validity of the official unemployment data which over several decades and much manipulation by successive governments has been tweaked many hundreds of times to under report true unemployment for political purposes. Current official unemployment stands at 1.86 million which is set against the total recorded as economically inactive of working age that stands at over 9 million which illustrates the true extent of failure of the last Labour government to manage the potential of the work force during the boom years as illustrated by the fact that 80% of the 2.1 million jobs created under Labour went to foreign workers and therefore did nothing to address the true level of UK unemployment that contained a hidden ticking social security financing time bomb that we have seen explode as an extra £40 billion annual budget deficit.
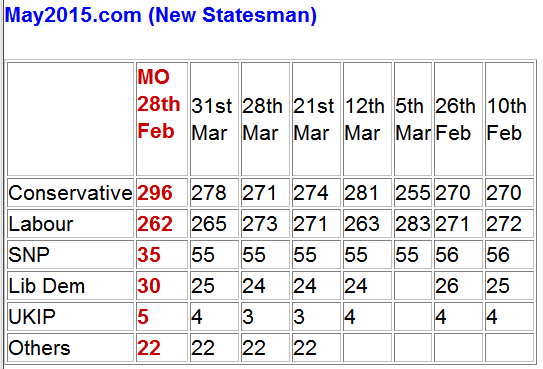
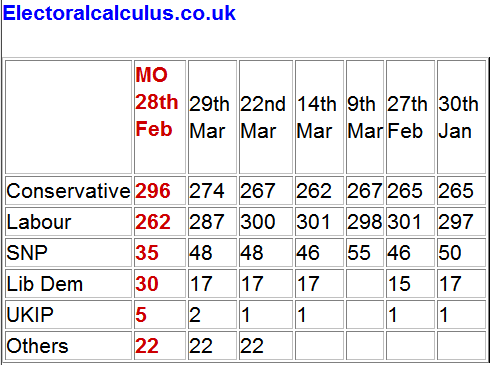
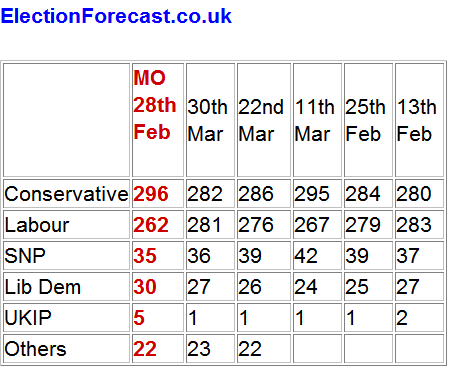
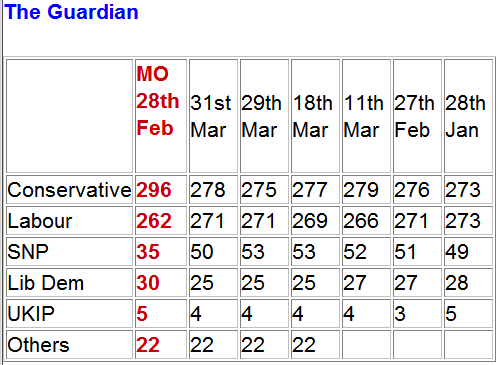
During the Conservative boom cycle, real unemployment fell from the 1983 crisis peak. However the same did not take place following the early 1990's recession where real unemployment failed to not only fall but steadily rose under Labours boom years as the benefits culture took hold as over 1 million foreign workers performed the jobs that unemployed Britain's were not prepared to do as they were far more comfortable living off tax payers as vested interests in Labours benefits for life culture, thus Labour engineered an extra 2 million positive voter balance i.e. 1 million more benefit claimants coupled with 1 million low paid immigrant workers that continued to increase long after the boom had ended. Whilst not all of the 9 million economically inactive are capable of seeking work, however the figure does imply that at least 4 million of the 9 million form the core of the what we all knows as the benefits culture i.e. the could work but won't work. Therefore the 4 million not counted in official unemployment numbers that choose not to work but instead prefer to rely on tax payer funded benefits added to the official 1.86 million unemployed results in a total UK unemployment count of 5.9 million. Which is more in line with the recession experience of other similarly in-debted and structured European countries. The Conservative led coalition has only been marginally successful in dismantling Labours benefits for life culture, as clearly the fall in real unemployment is nowhere on the scale of that which occurred following the early 1980's recession, when real unemployment was reduced by 1.2 million against just 300,000 during the past few years, implying that the Coalition has so far only barely begun at unraveling Labours pool of vested interest benefit claimants. Opinion Polls Election Seats Forecasts Last Thursdays Labour and Conservative leaders debates with Jeremy Paxman have introduced much volatility in the opinion polls as the instant Conservatives boost of Thursday night (26th March) evaporated within hours as several days on the main beneficiary has been Labour who have now once more are marginally flip flopping into the lead, though most pollsters still put both parties virtually neck and neck as clearly the people of Britain are indicating they do not trust either party to govern on their own, perhaps because they have become too similar, and therefore it still looks like being a voter choice between either a continuation of the Conservative - Lib Dem Coalition or take a chance on an Labour - SNP Axis. David Cameron's Debate with Jeremy Paxman and my facts check analysis- Ed Miliband's debate with Jeremy Paxman and my facts check analysis- The following is a list of the current state of seats forecasts by various popular mostly mainstream media funded election sites that are set against my own forecast of 28th Feb 2015. 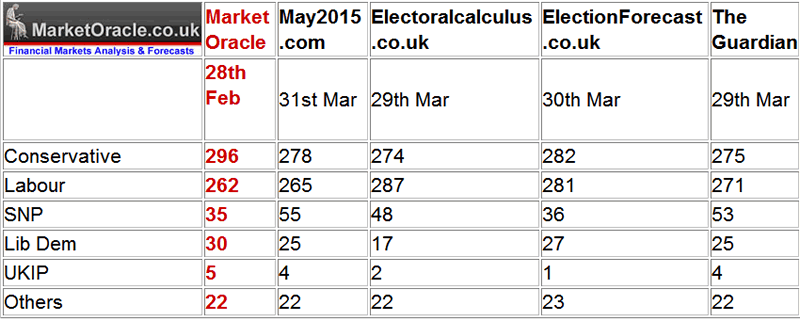
The following are individual forecaster trends and my analysis.
Tends to yo yo all over the place where one day its Labour then the next its Conservatives leading. Though the over-riding trend implies a very gradual convergence towards my forecast which it may achieve just prior to election day.
Are exhibiting a consistent strong bias towards Labour which has been eroding over time that again implies a gradual trend towards convergence with my forecast by election day but has a lot further to go then May2015.com.
After consistently putting the Conservatives in a clear seats lead, now post debates have both parties virtually neck and neck. So appear to be trending in the opposite direction i.e. favouring Labour.
Continues to maintain a marginal advantage to the Conservatives over Labour, currently within an tight 4 seat swing. Analysis The opinion pollsters are all trending in favour of the Conservative party which if the trend continues implies that Conservatives will be the largest party which is inline with my forecast expectations for the Tories to lead with at least 296 seats. Another point of difference is that pollsters continue to grossly over estimate the number of seats the SNP will win i.e. typically 50-55, against my expectations of just 35. Conclusion In my judgement the opinion polls whilst trending in the right direction are still wrong as they continue to persistently under estimate the number of seats the Conservatives will actually win and that could even win an outright majority on May 7th as per my long standing analysis of seats vs house prices trend trajectory that painted a picture for a likely probable Conservative general election victory. 16 Dec 2013 - UK General Election Forecast 2015, Who Will Win, Coalition, Conservative or Labour? The following graph attempts to fine tune the outcome of the next general election by utilising the more conservative current house prices momentum of 8.5% which has many implications for strategies that political parties may be entertaining to skew the election results in their favour.
The the key implications of the above graph are -
The updated election seats trend graph illustrates that the Conservatives are trending towards achieving a 15 seat majority outright election victory which NO ONE, and I mean no serious commentator / analyst either has or is currently advocating, so it would come is a big shock to pollsters on election day!
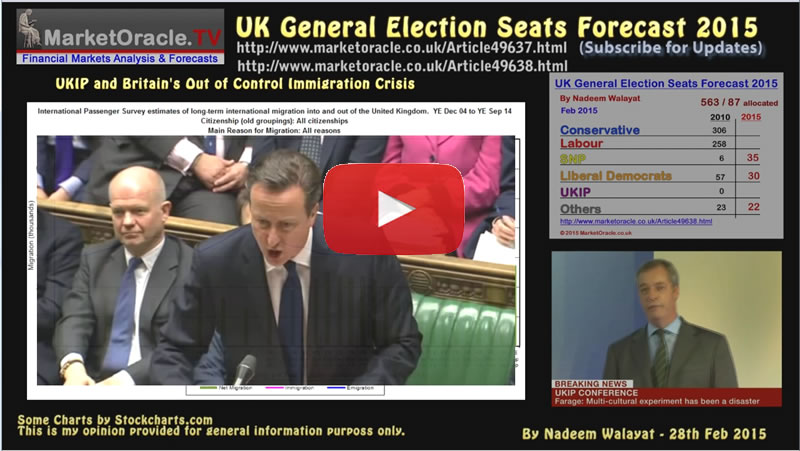
UK General Election Forecast 2015 In terms of what I actually see as the most probable outcome for the general election, I refer to my in-depth analysis of 28th Feb:
UK General Election May 2015 Forecast Conclusion My forecast conclusion is for the Conservatives to win 296 seats at the May 7th general election, Labour 2nd on 262 seats, with the full seats per political party breakdown as follows:
Therefore the most probable outcome is for a continuation of the ConDem Coalition government on 326 seats (296+30) where any shortfall would likely find support from the DUP's 8 seats. The alternative is for a truly messy Lab-Lib SNP supported chaotic government on 327 seats (262+30+35) which in my opinion would be a truly disastrous outcome for Britain, nearly as bad as if Scotland had voted for independence last September. Another possibility is that should the Conservatives do better than forecast i.e. secure over 300 seats but still fail to win an overall majority, then they may chose to go it alone with the plan to work towards winning a May 2016 general election. The bottom line is that the opinion polls do not reflect how people will actually vote on May 7th when they are faced with a stark choice of steady as she goes ConDem government or take a huge gamble on Ed Milliband's Labour party. So in my opinion several millions of voters will chose to play it safe with ConDem which thus is the most probable outcome. Also available a youtube video version of my forecast: The bottom line is that this election offers voters a choice of between a continuation of the steady as she goes Conservative Lib-Dem Coalition or to take a chance on a Labour SNP Axis that then goes on a debt fuelled spending spree for a couple of years or so before collapsing Britain into an early election some 2-3 years from now as the SNP insurgency will have achieved their tunnel vision mission of ejecting themselves out of the UK and into economic abyss. Ensure you are subscribed to my always free newsletter for in-depth analysis and detailed trend forecast delivered to your email in box. Source and Comments: http://www.marketoracle.co.uk/Article50080.html By Nadeem Walayat Copyright © 2005-2015 Marketoracle.co.uk (Market Oracle Ltd). All rights reserved. Nadeem Walayat has over 25 years experience of trading derivatives, portfolio management and analysing the financial markets, including one of few who both anticipated and Beat the 1987 Crash. Nadeem's forward looking analysis focuses on UK inflation, economy, interest rates and housing market. He is the author of five ebook's in the The Inflation Mega-Trend and Stocks Stealth Bull Market series that can be downloaded for Free.
Disclaimer: The above is a matter of opinion provided for general information purposes only and is not intended as investment advice. Information and analysis above are derived from sources and utilising methods believed to be reliable, but we cannot accept responsibility for any trading losses you may incur as a result of this analysis. Individuals should consult with their personal financial advisors before engaging in any trading activities.
You're receiving this Email because you've registered with our website. How to Subscribe Click here to register and get our FREE Newsletter To access the Newsletter archive this link Forward a Message to Someone [FORWARD] To update your preferences [PREFERENCES] How to Unsubscribe - [UNSUBSCRIBE]
The Market Oracle is a FREE Financial Markets Forecasting & Analysis Newsletter and online publication. |
|||||||||||||||||||||||||||||||
© 2005-2022 http://www.MarketOracle.co.uk - The Market Oracle is a FREE Daily Financial Markets Analysis & Forecasting online publication.


