


Europe's Stocks Bull Market Continues After Correction
Stock-Markets / Stock Markets 2015 May 18, 2015 - 01:03 PM GMTBy: Dr_Jeff_Lewis

 While we comment on most of the markets we follow at least once a week. We thought a consolidated report on the various sectors might help clarify what we are seeing medium and long term. This is the reason for the various reports these past few days.
Other than the US, we track eighteen indices that are country specific, one area specific, and one worldwide. In Europe we track eight indices, Asia eight indices, three indices in what we call the commodity group, and the DJ World index.
European indices can be divided into two groups: those that made their bear market lows in 2009, and those that made it in 2012. Obviously their overall counts will be different. We will cover the 2009 group first.
iDAX
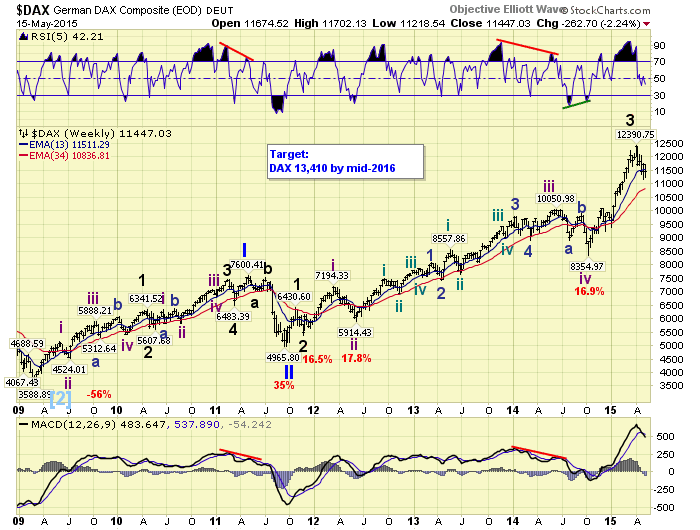
Of all the foreign indices we track Germany’s DAX has had the cleanest wave pattern. Primary waves I and II completed in 2011 and Primary wave III is still underway, just like the SPX. Also like the SPX, the DAX made all time new highs in 2013, and has continued to rise. We have labeled the recent all time high as Major wave 3, with Major wave 4 underway now. Since Major wave 2, and Intermediate waves ii and iv, all corrected over 15%. We are expecting a Major wave 4 low around 10,600. Then a resumption of the bull market. In January 2015 we projected a 2016 target of 13,410. The DAX has already hit 12,391, so the target may easily be achieved and exceeded.
iFTSE
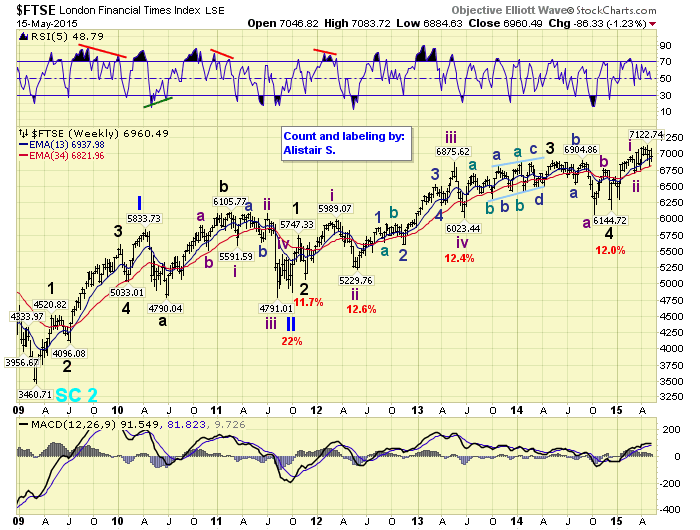
England’s FTSE’s pattern does not look anything like the DAX as it has been quite choppy. It is in Primary wave III, and made a new all time high this year. We have labeled it as being in the early stages of Major wave 5, with Intermediate waves i and ii complete. However, what was expected to be the beginning of Intermediate wave iii may only be a Minor b wave of a more complex Intermediate ii. During Primary III Major waves 2 and 4 corrected around 12%, as did Intermediate waves ii and iv. It appears Intermediate wave ii, which is much smaller as labeled, may be doing an irregular flat. Basically using time to work off an overbought condition, rather than price.
iSMI
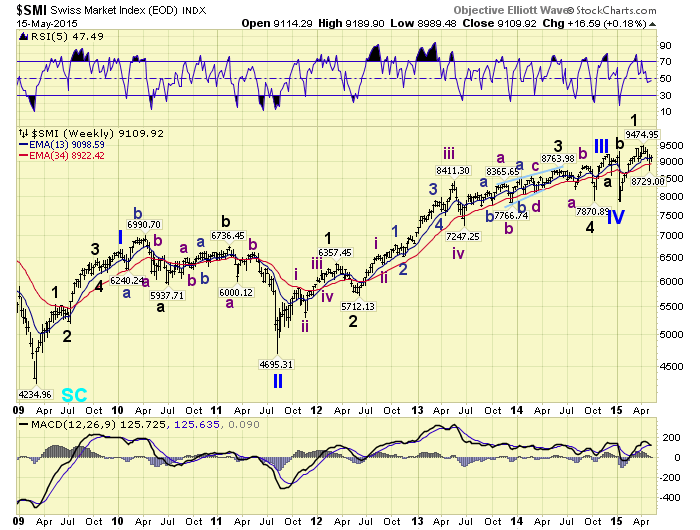
Switzerland’s SMI has yet another pattern from its 2009 low. A Primary I high in 2010, and a Primary II low in 2011. In response to the SNB’s de-pegging of the CHF from the EUR it had a Primary III high in late-2014, then a Primary IV low in early-2015. It is currently already in its Primary wave V. Despite the index more than doubling since 2009, it has yet to reach the 2007 all time high of 9,531. Clearly an underperformer compared to the DAX, but similar to many other European indices.
iCAC
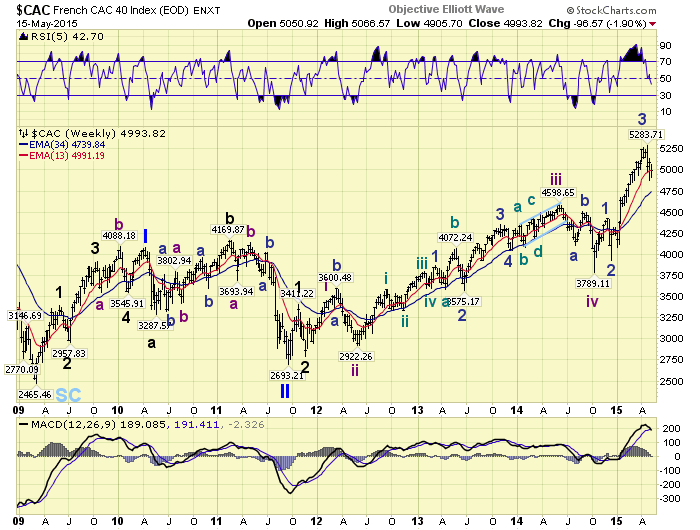
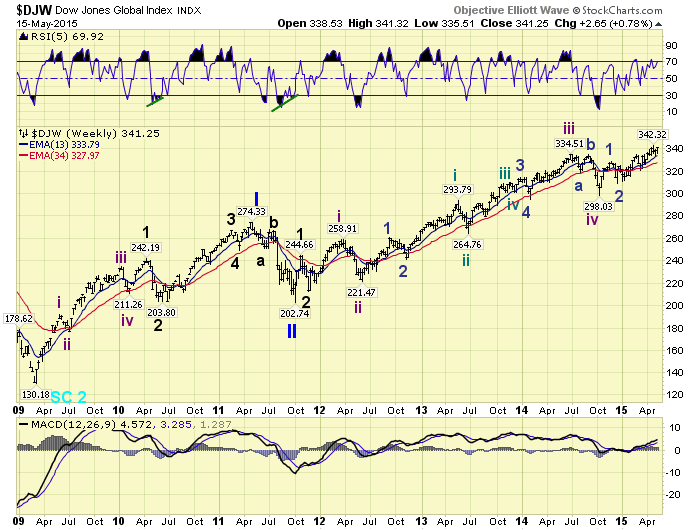
Despite a more than double in France’s CAC since 2009, it is still far below its all time highs. In the year 2000 the CAC hit a high of 6945, a lower high in 2007 at 6168, and during this bull market it has only reached 5284 thus far. The bull market pattern displays a Primary I high in 2010, a Primary II low in 2011, and Primary III still underway. The current wave pattern suggests the CAC needs one more new high to align with the Major wave 3 high in the DAX. Actually the CAC’s Primary III wave pattern is more in line with the DJ world index than the other major European indices.
iDJW
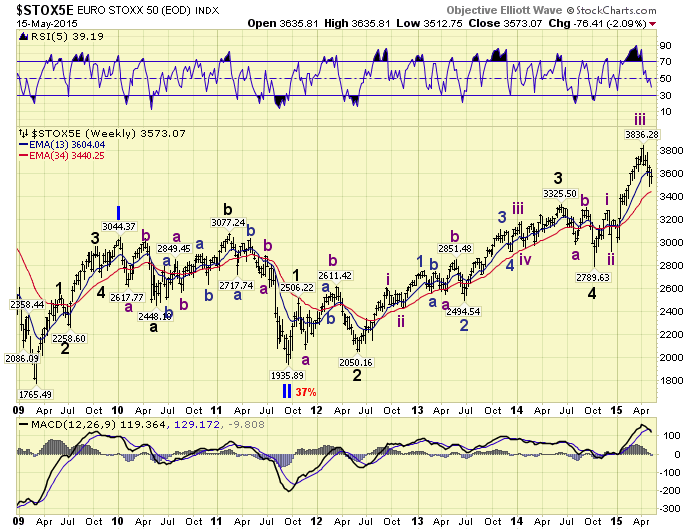
Europe’s STOX 50, an attempt at offering a broad index for all of Europe, has been a major underperformer as well. Its all time high was in 2000 at 5522, had a secondary high in 2007 at 4573, and has only reached 3836 during this bull market. Its bull market also displays a Primary I in 2010, a Primary II in 2011, and a Primary III underway since then. After a choppy beginning to Primary III it appears to be in Major wave 5. The wave pattern looks somewhat similar to the FTSE. But the STOX has recently performed much better than the FTSE due to the surges in the DAX, CAC, MIB and IBEX. Which are all benefitting from the ECB’s EQE program. Before this bull market ends it appears the STOX, and the CAC for that matter, should reach their 2007 highs.
iSTOX
We will cover the remaining the European indices, along with the commodity index group in the next report. You can follow all the International indices on pages 5 – 8 using this link: http://stockcharts.com/public/1269446/tenpp/5
After about 40 years of investing in the markets one learns that the markets are constantly changing, not only in price, but in what drives the markets. In the 1960s, the Nifty Fifty were the leaders of the stock market. In the 1970s, stock selection using Technical Analysis was important, as the market stayed with a trading range for the entire decade. In the 1980s, the market finally broke out of it doldrums, as the DOW broke through 1100 in 1982, and launched the greatest bull market on record.
Sharing is an important aspect of a life. Over 100 people have joined our group, from all walks of life, covering twenty three countries across the globe. It's been the most fun I have ever had in the market. Sharing uncommon knowledge, with investors. In hope of aiding them in finding their financial independence.
Copyright © 2015 Tony Caldaro - All Rights Reserved Disclaimer: The above is a matter of opinion provided for general information purposes only and is not intended as investment advice. Information and analysis above are derived from sources and utilising methods believed to be reliable, but we cannot accept responsibility for any losses you may incur as a result of this analysis. Individuals should consult with their personal financial advisors.
Tony Caldaro Archive |
© 2005-2022 http://www.MarketOracle.co.uk - The Market Oracle is a FREE Daily Financial Markets Analysis & Forecasting online publication.