Lumber Lambasted
Commodities / Commodities Trading May 14, 2015 - 12:09 PM GMTBy: Austin_Galt
 Lumber has been punished lately with around 30% lopped off the price already this year. The bulls have walked the plank and exclaimed “Shivers me timbers!”
Alright, enough hijinx. Let’s analyse the technicals using the weekly, monthly and yearly charts.
LUMBER WEEKLY CHART

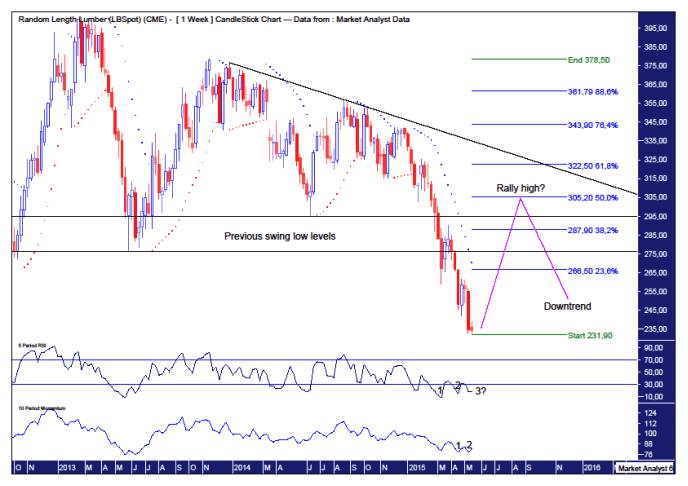
We can see the lambasting of price recently with it being virtually all downhill this year. However, the downtrend looks in need of a break and I suspect a bear rally is close at hand.
The PSAR indicator, which pertains to the dots, has had a bearish bias for quite some time now and is starting to look long in the tooth. Breaking these dots on the upside will likely confirm the bear rally is on.
The RSI shows a potential triple bullish divergence at this recent low of US$231.90 and that often leads to a significant rally.
The Momentum indicator looks like the move down is running out of puff and has put in a bullish divergence at the recent low.
So, if a bear rally is set to kick off, just how high can we expect price to trade?
I have drawn two horizontal lines denoting previous swing lows which set at US$276 and US$295 respectively. These levels may provide resistance but I think price can punch a bit higher and give these resistance levels a solid test.
I have added Fibonacci retracement levels of the move down and I am targeting the 50% level at US$305 to see in the high. Price turning down here or below would keep the downtrend in a strong position which is my expectation.
I have drawn a downtrend line and breaking above there would likely indicate the bear trend is over. Unlikely in my opinion and I doubt price will even go close.
Let’s move on to the monthly chart.
LUMBER MONTHLY CHART

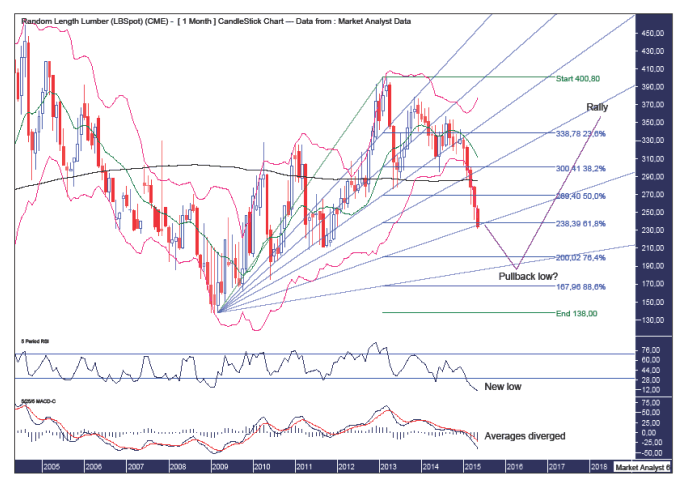
The Bollinger Bands show price clinging to the lower band in bearish style. I expect any rally will find resistance at the middle band.
I have added a Fibonacci Fan which shows price is now down at the 76.4% angle. I favour some temporary support to come in at this angle. Perhaps a bear rally might see price bounce back up to the 61.8% angle but that should be the limit.
Once the bear rally is over, I favour a move down to final low which I expect to be around support from the 88.6% angle.
I have added Fibonacci retracement levels of the recent move up and price is now down at the 61.8% level which is a popular area for support so a rally would certainly be of no surprise to Fibonacci followers. However, I am targeting the 76.4% level at US$200 for the final pullback low to form and possibly a touch lower.
The RSI is showing a new low reading which is generally quite bearish. This indicator is quite oversold so a rally would unwind this bearish condition. Then perhaps price can make a new low which is accompanied by a higher RSI reading – a bullish divergence.
The MACD indicator has been trending down bearishly but the averages have diverged quite a lot and a rally now would be just the tonic to relieve this extreme condition and return the averages to normalcy.
Also, I have added the 200 period moving average which is denoted by the black line. Price has been oscillating around this average for years and is now in the bearish phase. Once the final pullback low is in place I expect a solid rally to ensue which sees price back above this average.
Let’s wrap it up by looking at the big picture yearly chart.
LUMBER YEARLY CHART

There is quite a bit of interesting information on this chart so let’s break it down.
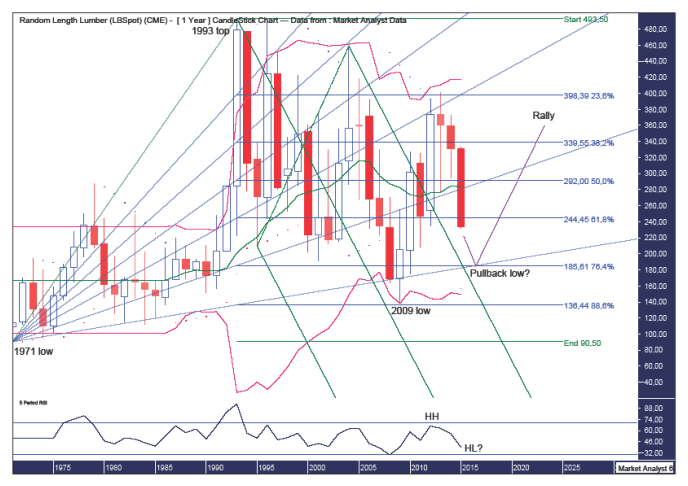
The PSAR indicator has a bullish bias after price busted the dots on the upside in 2013. The dots are now underneath price and represent support. Price now looks to be coming back down to test this support which I expect to hold. The dots this year stand at US$157 and next year will be around US$165.
The Bollinger Bands show a massive consolidation to be in play with price bouncing up and down between the upper and lower bands with price now seemingly headed back down to the lower band. The lower band is currently just above US$150 and rising.
I have added Fibonacci retracement levels of the move up from 1971 low to 1993 top. The 2009 low was right at support from the 88.6% level and I now expect the next low to be around the 76.4% level which stands at US$185.
I have drawn a Fibonacci Fan which has shown some nice price symmetry. The 2009 low gave the 88.6% angle a good test while the recent high was at resistance from the 61.8% angle. I am now looking for price to come back to the 88.6% angle once again and bounce off it.
The RSI has a higher high in place and I expect the coming low to set up a higher low which would give confidence to a solid move higher in price after that.
Finally, in a bullish development, the Andrew’s Pitchfork shows price broke out of this bearish formation back in 2011. As often happens after this event, price comes back down but is held by the upper channel before turning back up. This is certainly my expectation here.
So, while things may appear quite bearish for lumber in the short to medium term, there are several bullish indications which augur for higher prices over the longer term.
By Austin Galt
Austin Galt is The Voodoo Analyst. I have studied charts for over 20 years and am currently a private trader. Several years ago I worked as a licensed advisor with a well known Australian stock broker. While there was an abundance of fundamental analysts, there seemed to be a dearth of technical analysts. My aim here is to provide my view of technical analysis that is both intriguing and misunderstood by many. I like to refer to it as the black magic of stock market analysis.
Email - info@thevoodooanalyst.com
© 2015 Copyright The Voodoo Analyst - All Rights Reserved
Disclaimer: The above is a matter of opinion provided for general information purposes only and is not intended as investment advice. Information and analysis above are derived from sources and utilising methods believed to be reliable, but we cannot accept responsibility for any losses you may incur as a result of this analysis. Individuals should consult with their personal financial advisors.
Austin Galt Archive |
© 2005-2022 http://www.MarketOracle.co.uk - The Market Oracle is a FREE Daily Financial Markets Analysis & Forecasting online publication.


