Lindsay Forecasting the End of the Stocks Bull Market
Stock-Markets / Stock Markets 2015 May 13, 2015 - 10:48 AM GMTBy: Ed_Carlson
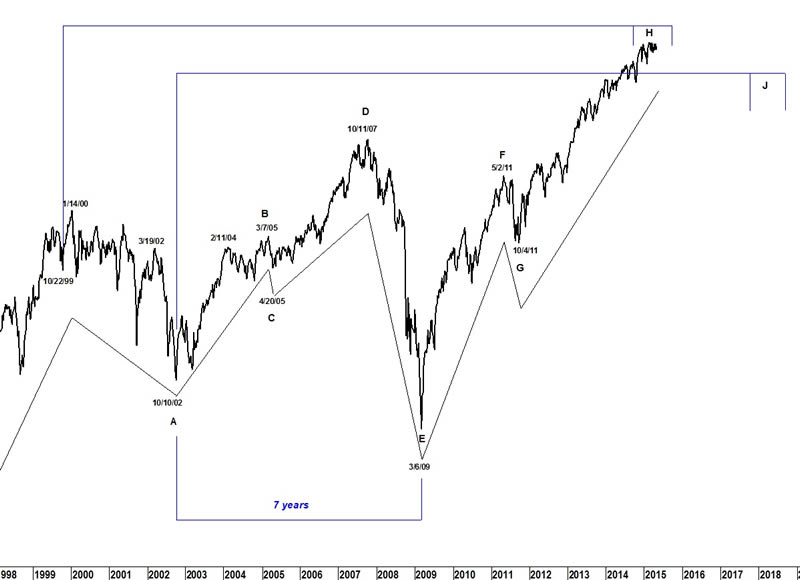
 The first step in forecasting an important high is accomplished using Lindsay's 15yr interval. It isolates an eleven month period in which the high is found. Lindsay wrote that the interval (15yr-15yr, 11m) can be counted from any "important" low leaving the identification of the low somewhat ambiguous.
In my own attempt to derive a more structured approach to identifying "important" lows I found that most successful intervals have their origins at either a labeled point on Lindsay's long cycle (points A, C, E, G, I, and K)or the low of a Separating Decline in a Three Peaks/Domed House pattern. However, most does not mean always and that is the situation we find ourselves in presently.
The final low before the bull market top in 2000 was in Oct 1999. It counts (15yr-15yr, 11m) to a high in the period Oct 2014-Sept 2015.
The next 15y interval is counted from the low in 2002. It forecasts a high in the period from Oct 2017-Sept 2018 . Lindsay did write that the period between points D and A is roughly 12yrs, A to E is 7yrs, and A to J is 15yrs. A high in 2018 matches expectations for point J to be 15yrs beyond point A (10/10/02). Point J need not be higher than point H.
Lindsay's long cycle

Long Cycles since 1798

Try a "sneak-peek" at Lindsay research (and more) at Seattle Technical Advisors.
Ed Carlson, author of George Lindsay and the Art of Technical Analysis, and his new book, George Lindsay's An Aid to Timing is an independent trader, consultant, and Chartered Market Technician (CMT) based in Seattle. Carlson manages the website Seattle Technical Advisors.com, where he publishes daily and weekly commentary. He spent twenty years as a stockbroker and holds an M.B.A. from Wichita State University.
© 2015 Copyright Ed Carlson - All Rights Reserved
Disclaimer: The above is a matter of opinion provided for general information purposes only and is not intended as investment advice. Information and analysis above are derived from sources and utilising methods believed to be reliable, but we cannot accept responsibility for any losses you may incur as a result of this analysis. Individuals should consult with their personal financial advisors.
© 2005-2022 http://www.MarketOracle.co.uk - The Market Oracle is a FREE Daily Financial Markets Analysis & Forecasting online publication.


