


Stock Market Choppiness Continues
Stock-Markets / Stock Markets 2015 May 09, 2015 - 07:01 PM GMTBy: Tony_Caldaro

 Another one of those choppy weeks. The market started the week at SPX 2108. Gapped up on Monday hitting SPX 2121, dropped to 2068 by Wednesday despite a gap up opening that day, then rallied to 2118 on Friday with also a gap up opening. Three gap up openings on the week, net gain 8 points. For the week the SPX/DOW were +0.65%, the NDX/NAZ were mixed, and the DJ World index was +0.30%. On the economic front reports continued to come in positive. On the uptick: factory orders, ISM services, consumer credit, monthly payrolls, wholesale inventories, the WLEI, and the unemployment rate improved. On the downtick: the ADP index, the MMIS, and both weekly jobless claims and the trade deficit increased. Next week is highlighted by Industrial production, Retail sales and the PPI.
LONG TERM: bull market
Last weekend we noted there was a potential Primary III five wave pattern from the SPX 1075 low in 2011 completing, and four of our long term indicators were displaying negative divergences. These divergences usually occur during these types of highs. This week one of the indicators got close to eliminating the negative divergence. But it did not happen. As a result, this potential count is still under consideration.
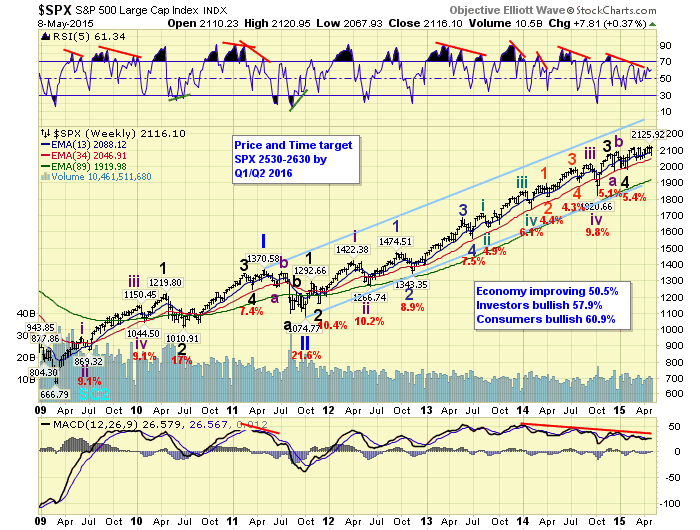
A more bullish count, which we prefer at the moment, suggests this choppy uptrend, from the early February Major 4 low, is forming an Intermediate wave one leading diagonal triangle. This suggests, when the diagonal concludes, a sharp selloff to the lower SPX 2040’s or the 2019 pivot range for Intermediate wave two should follow. Then a resumption of Primary III. There are a few in our OEW group that are seeing potential impulse waves during this uptrend, as a series of 1-2’s. Should the market clear the OEW 2131 pivot range that possibility would improve. Thus far, despite all the gyrations over the past two months, the SPX high is 2126.
We continue to count this bull market as a Cycle wave [1] consisting of five Primary waves. Primary waves I and II completed in 2011, and Primary wave III has been underway since then. When Primary III does conclude the market should experience its largest correction since 2011 for a Primary wave IV. Then when it concludes Primary V should take this market to all time new highs. We still expect a bull market high in the year 2017.
MEDIUM TERM: bungee uptrend continues
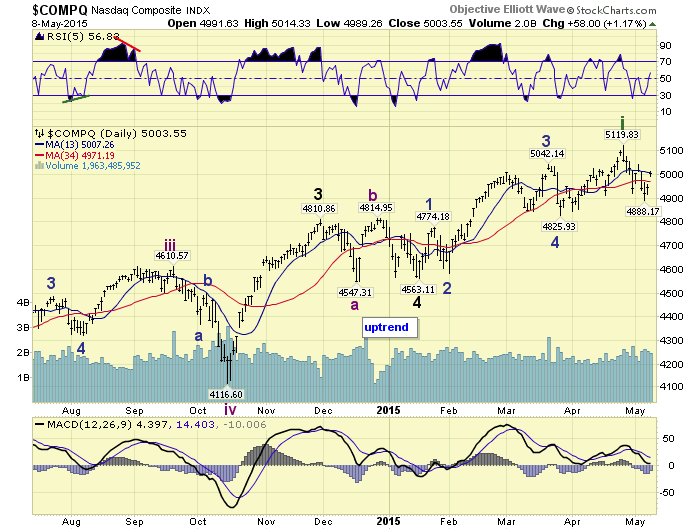
After reviewing the charts we observe a nice five wave advance in the NAZ from mid-January to the late-April high.
However, during this period we see one good impulsive rally in the SPX during the month of February, then lots of choppy activity into its 2126 high and thereafter.
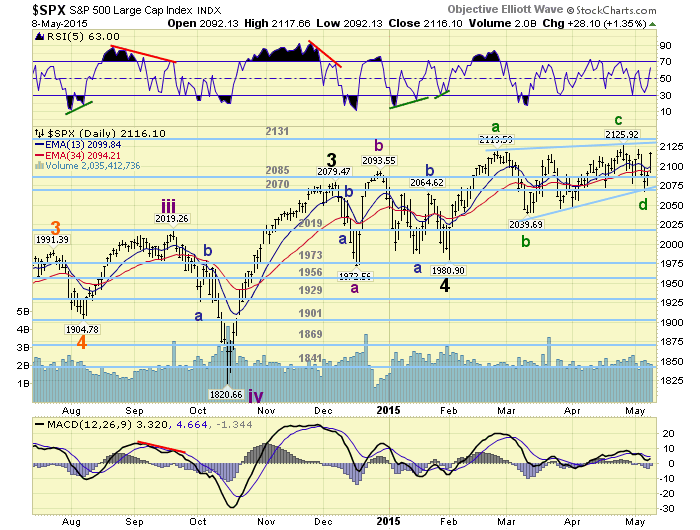
The NDX/NAZ look like they have completed a nice impulse wave during their uptrend. While the SPX appears to be completing a leading diagonal triangle during its uptrend. Both wave patterns suggest a correction should, if not already, be underway soon. When we do get downtrend confirmations we expect support around the low 2040’s or possibly the 2019 pivot range for Intermediate wave ii. If the market breaks the 2019 pivot range, and then heads towards the 1973 pivot, Primary IV may be underway. Medium term support is at the 2085 and 2070 pivots, with resistance at the 2131 and 2198 pivots.
SHORT TERM
This week’s activity added to the probability of the diagonal triangle scenario, as the market sold off but quickly reversed yet again. We are counting the diagonal as follows: (a) 2120, (b) 2040, (c) 2126, (d) 2068, (e) underway. The rising wedge suggests the SPX could make a marginal new high before it completes. As noted last week, negative divergences remain on the weekly RSI and MACD. Plus there is a negative RSI divergence and a negative MACD crossover on the monthly chart.
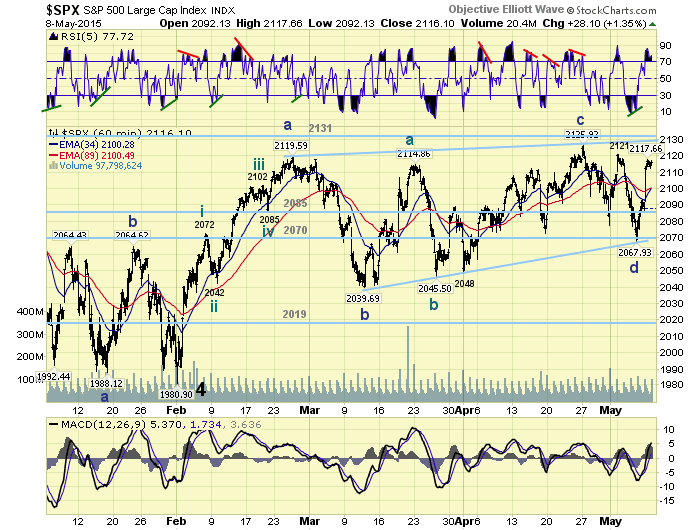
Difficult, indecisive, market these past two months. Suggest a bit of caution going forward. Short term support is at the 2085 and 2070 pivots, with resistance at SPX 2121 and the 2131 pivot. Short term momentum ended the week quite overbought.
FOREIGN MARKETS
The Asian markets were mostly lower losing 1.4% on the week.
The European markets were all higher gaining 1.1% on the week.
The Commodity equity group were mixed gaining 1.0% on the week.
The DJ World index is still uptrending and gained 0.3%.
COMMODITIES
Bonds are downtrending but finished flat on the week.
Crude is still uptrending and gained 0.2% on the week.
Gold remains in a downtrend but gained 1.0% on the week.
The USD remains in a downtrend and lost 0.6% on the week.
NEXT WEEK
Tuesday: the Treasury Budget. Wednesday: Retail sales, Export/Import prices and Business inventories. Thursday: weekly Jobless claims, and the PPI. Friday: the NY FED, Industrial production, Consumer sentiment and Options expiration. Best to your weekend and week! Best to your weekend and week!
CHARTS: http://stockcharts.com/public/1269446/tenpp
http://caldaroew.spaces.live.com
After about 40 years of investing in the markets one learns that the markets are constantly changing, not only in price, but in what drives the markets. In the 1960s, the Nifty Fifty were the leaders of the stock market. In the 1970s, stock selection using Technical Analysis was important, as the market stayed with a trading range for the entire decade. In the 1980s, the market finally broke out of it doldrums, as the DOW broke through 1100 in 1982, and launched the greatest bull market on record.
Sharing is an important aspect of a life. Over 100 people have joined our group, from all walks of life, covering twenty three countries across the globe. It's been the most fun I have ever had in the market. Sharing uncommon knowledge, with investors. In hope of aiding them in finding their financial independence.
Copyright © 2015 Tony Caldaro - All Rights Reserved Disclaimer: The above is a matter of opinion provided for general information purposes only and is not intended as investment advice. Information and analysis above are derived from sources and utilising methods believed to be reliable, but we cannot accept responsibility for any losses you may incur as a result of this analysis. Individuals should consult with their personal financial advisors.
Tony Caldaro Archive |
© 2005-2022 http://www.MarketOracle.co.uk - The Market Oracle is a FREE Daily Financial Markets Analysis & Forecasting online publication.