UK Election Forecast 2015 - Who Will Win?
ElectionOracle / UK General Election May 01, 2015 - 06:19 PM GMTBy: Nadeem_Walayat
 There remain just 6 days until the voters of Britain go to the polls with the nations share of the vote spread widely amongst Britain's 6 significant political parties that has prompted a daily flood of bribes from politicians from housing market subsidies to tax cutting promises to spending bonanzas on public services, where virtually 70% of that which is being promised just cannot happen because politicians promises to increase spending, cut taxes AND cut the deficit are pure smoke and mirrors, which most voters well understand and why there has been so little shift in the opinion polls following two months of intense campaigning and thus unlikely to shift in the remaining few days becasue voters understand that probability favours another minority led coalition government of sorts which means that at least 1/3rd of the manifestos never mind the more recent promises will be jettisoned with many excuses ready for why.
This article seeks to analyse the opinion polls trend trajectories into the May 7th election to determine the most probable outcome, as well as factoring in what is going on at the constituency level which tends to paint a different picture to what the national opinion polls suggest, and then compared against my own long standing forecast and its drivers such as average house prices.
Opinion Pollster Seats Forecasts

The opinion pollster seats forecasts average at:
- Conservatives : 278
- Labour : 269
- SNP : 54
- Lib Dems : 24
The calculations for what form a coalition government could take are extremely complicated if not impossible without resorting to the disastrous outcome that involves the SNP who are determined on destroying the UK i.e.
Conservatives + Lib Dems = 302 - FAIL
Add DUP 8 seats = 310 - FAIL
Whilst Labour + Lib Dems = 293 - FAIL
Which means the ONLY viable / workable outcome would be one that involves the SNP i.e. Labour + SNP = 323 - SUCCESS
The following are individual forecaster trends and my analysis.
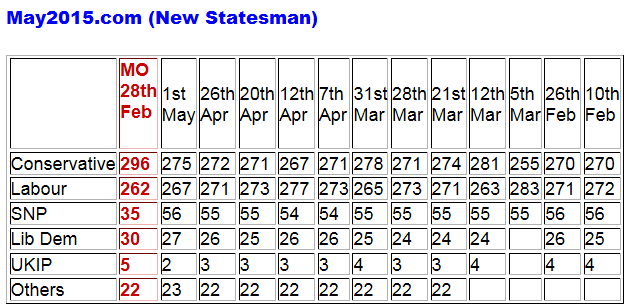
Literally flip flops between Labour and Conservative from week to week within a tight 10 seat range of one another. Latest swing is in the Conservatives favour, that is trending towards 278 to 265 by election day.
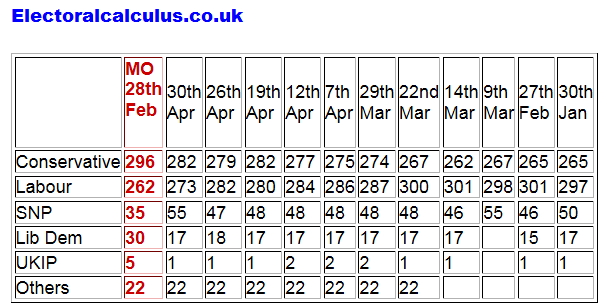
Have consistently exhibited a strong bias towards Labour which has been slowly eroding over time that has now swung in the Conservatives favour. The latest forecasts also swings heavily towards the SNP by allocating a further 8 Labour seats to the SNP.
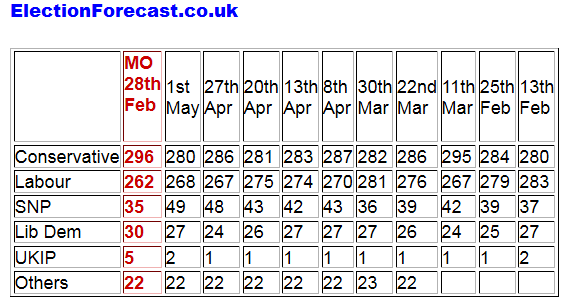
Tends to consistently put the Conservatives in a clear seats lead, though the most recent data shows a narrowing in this Conservative lead.
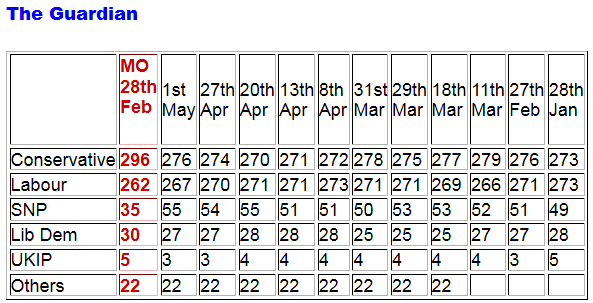
Tends to exhibit a marginal advantage to the Conservatives within a tight 10 seat band. Implies the Conservatives seat range on election day will be between 274 and 279 seats.
Opinion Polls Seats Forecast Trend Analysis
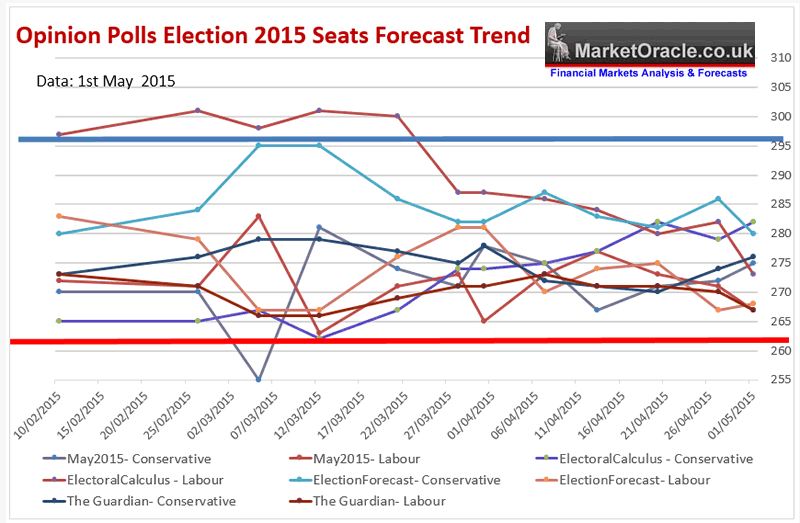
The opinion polls have been weakly trending in the Conservatives party favour for the past 2 weeks. But unfortunately for the Tories is showing no signs of accelerating from the current 278 average, that at best would trend to 283 seats whilst Labour is mostly flat-lining which implies little change form the current average of 269 seats.
The real big story of 2015 is the SNP surge in Scotland where all pollsters are converging towards a total annihilation of Labour in Scotland with the SNP averaging on 54 seats, and Labour potentially losing ALL of their 41 seats.
If the opinion polls trend does pan out then the only workable majority would be Labour 269 + SNP 54 for a 323 seats nationalists driven weak Labour minority government. Which implies that with just 6 days it go it may now be too late for the Conservatives to achieve critical mass of at least 294 seats (294+29 for 323).
Constituency Election Battles - Nick Clegg, Sheffield Hallam
A detailed look at the Lib Dem leaders election battle in the Sheffield Hallam constituency illustrates the point that the national opinion polls have a tendency to under-estimate the number of seats that the parties of government will actually win on election day.
The latest Lord Ashcroft opinion poll for Sheffield Hallam shows that Labour has managed to maintain a slender lead over the Lib Dem Leader as Nick Clegg fights a ferocious battle to prevent losing his seat to the Labour candidate Oliver Coppard, which if lost would scupper any hopes for a continuation of the Tory led Coalition as without Nick Clegg the left of centre Lib Dems with veer towards the Labour party even if it would result in messy outcome that involves the Scottish Nationalists.
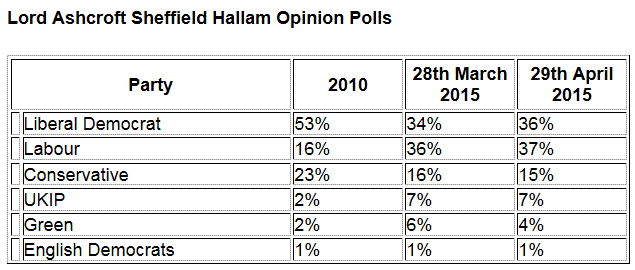
Whilst Labour has managed to cling onto a slender lead over the Lib Dems by 1% on 37% against 36%. However, this poll does show a trend where tactical voters are favouring the Lib Dem leader on a 2 to 1 margin i.e. for every 1% Labour tends to add to its percentage share of the vote then the Lib Dems adds 2%. Which is not so surprising given that out of the remaining 27% of other party voters, 23% are right of centre whilst only 4% are left of centre which leaves a huge pool for the Lib Dems to capitalise upon on election day when the choice facing Conservatives and UKIP voters will be whether to lend their vote to Nick Clegg or see the Sheffield Hallam seat fall to Labour, especially as the Lib Dems have literally gone to war in an attempt to hold onto some 40 key seats that includes Sheffield Hallam as illustrated by my recent video analysis:
This supports my longstanding view that the opinion polls and mainstream political pundits continue to paint an erroneous picture that seats such as Nick Clegg's are at risk of being lost...
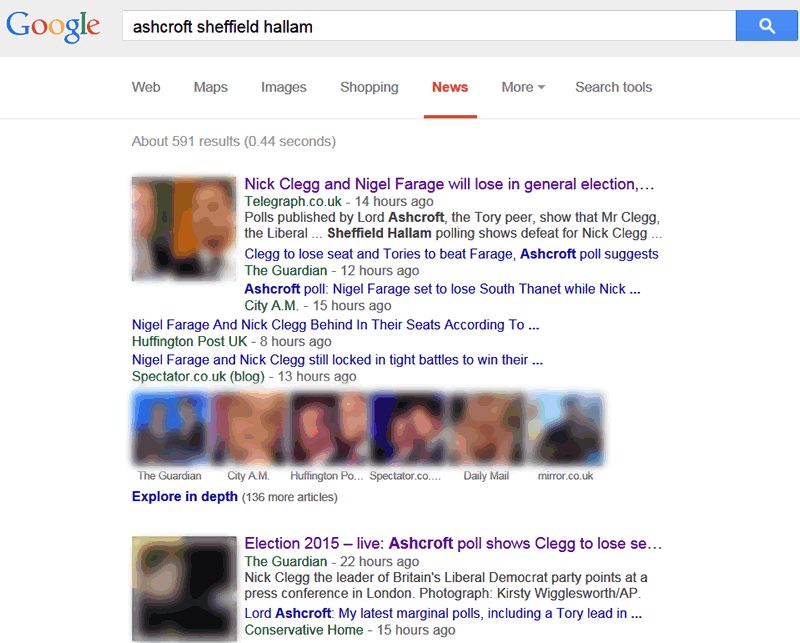
... not just for Nick Clegg's Sheffield Hallam constituency but right across England that the polls tend to grossly under estimate how many votes and seats the Lib-Dems and Conservatives as the parties of government will actually win on election day. Where instead of Sheffield Hallam being an election battle between Labour and the Lib-Dems:

Instead the reality for many voters following 5 years of coalition government is one of this:

Therefore at the constituency level Labour is NOT fighting election battles against the Lib-Dems or the Conservatives but rather they are effectively battling against the Coalition party. Which means that in this general election we will witness tactical voting on a far greater scale amongst Lib-Dems and Conservatives than we saw at the 2010 general election where as many as 50% of voters will lend their vote to a Coalition partner. The consequences of which will be that both the Lib Dems and Conservatives will retain many more seats than the opinion polls suggest i.e. that Nick Clegg rather than being at risk of losing his seat, in reality will win with a sizable majority of at least 5000 votes as Conservative voters will in great numbers vote for the Lib-Dems in those seats where the Conservatives are not the main competitor so as to increase the probability for the continuation of the Tory led Coalition government rather than risk a Labour government.
So for the Lib-Dems the real election battleground is not against Labour but the Conservatives where they are the main competitor, as the Tories are seeking to take at least 15 seats from the Lib Dems. Whilst at the same time trying to ensure the Lib-Dems retain as many seats as possible where Labour is second, and conversely Lib Dem voters whilst to a lesser extent are also likely to vote for the Tory candidate where Labour is opposing, especially as the prospects of a Labour- SNP outcome sends shivers down the spines of many English Labour and Lib-Dem voters. This will also prompt many potential UKIP voters to vote Conservative or Lib Dem rather than risk a Labour - SNP.
UK Housing Market and the Election 2015
Britains housing crisis is one of limited new build supply that consistently fails to keep pace with new demand that typically tends to average twice the rate of supply resulting in an worsening housing crisis each year which explains why academic theories of UK house prices being in a bubble that is always imminently destined to burst persistently fails to materialise. Instead the reality is one of house prices relentlessly grinding ever higher with an ever escalating house prices to earnings ratio that on an average stands at over 7X earnings, and far beyond that of virtually every other western nation and in some parts of the UK is greater than 25X earnings.
Video analysis topics covered:
- UK population forecast
- Immigration crisis
- House building and over-crowding crisis
- Demographics - Ageing population
- Political parties and house prices
- Debt and inflation.
- UK house prices forecast
- Opinion polls seats forecasts
- UK general election forecast
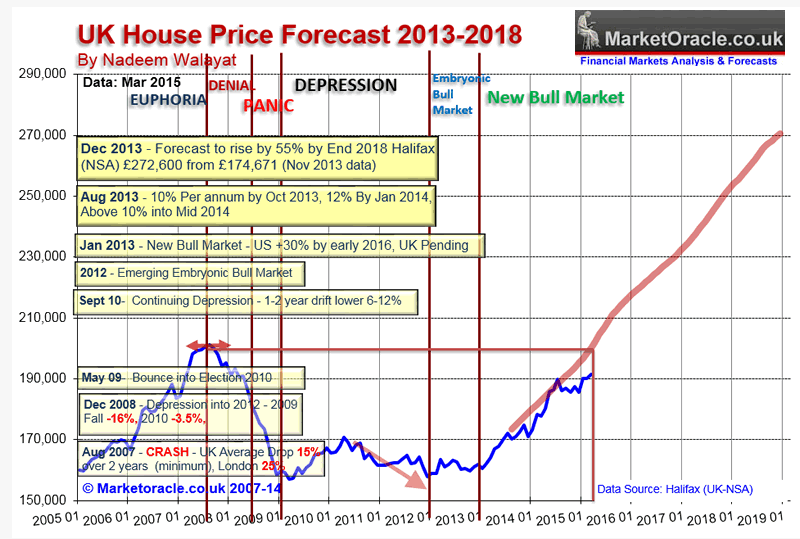
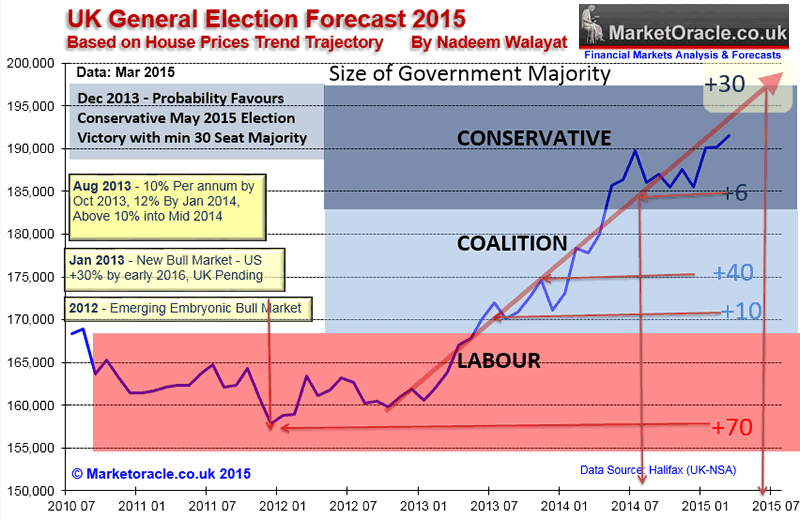
The latest Halifax average house prices (NSA) data released for March 2015 of £191,551 is showing a continuation of the bull trend after the pause of August to December 2014. House prices are currently showing a deviation of 4% against the forecast trend trajectory. In terms of the long-term trend forecast for a 55% rise in average UK house prices by the end of 2018, if the current deviation continued to persist then this would result in an 15% reduction in the forecast outcome to approx a 40% rise by the end of 2018.
30 Dec 2013 - UK House Prices Forecast 2014 to 2018, The Debt Fuelled Election Boom
Implications for Election 2015
Momentum has picked up from February's +6.6%, to +7.7% for March, though has missed the headline grabbing new all time high in average UK house prices just prior to election day, probably due to ongoing weakness in house prices in the South East.
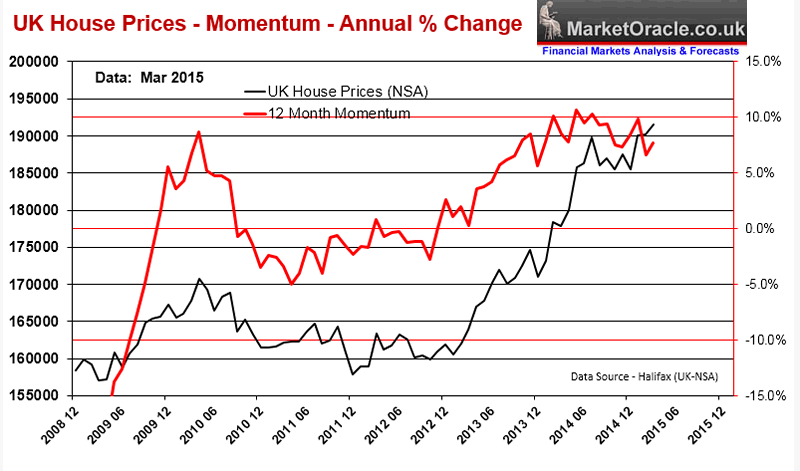
Therefore the Conservatives mini election boom appears to have failed to spike to a +10% inflation rate for election day, where my expectations were that it could have ranged to as high as +12% for an outright majority 30 seats inducing result as my long-standing analysis of seats vs house prices trend trajectory forecast.
16 Dec 2013 - UK General Election Forecast 2015, Who Will Win, Coalition, Conservative or Labour?
The following graph attempts to fine tune the outcome of the next general election by utilising the more conservative current house prices momentum of 8.5% which has many implications for strategies that political parties may be entertaining to skew the election results in their favour.
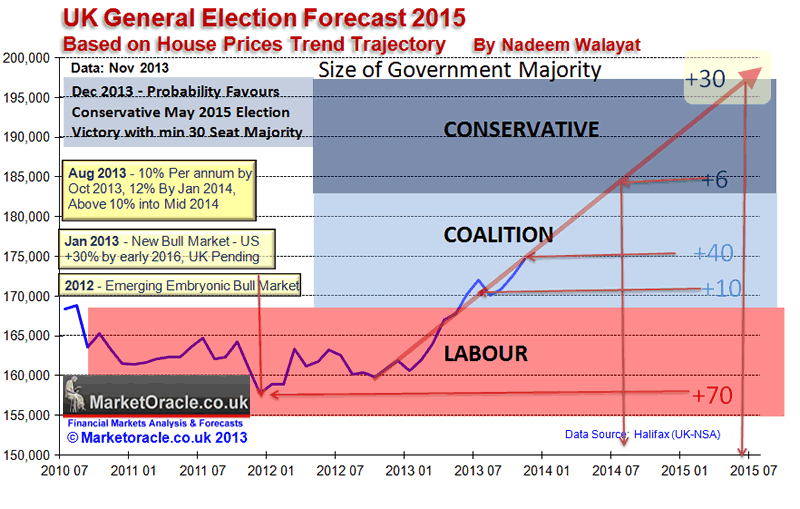
The updated election seats trend graph suggests that the Conservatives are on target towards achieving a single digits outright majority which is completely contrary to every opinion poll published this year. Which if it materialises then I am sure for Election 2020 everyone will be staring at the house prices indices rather than the opinion polls. Though as is usually the case that when the consensus becomes focused on an particular indicator then it usually stops working.
UK Election Forecast Conclusion
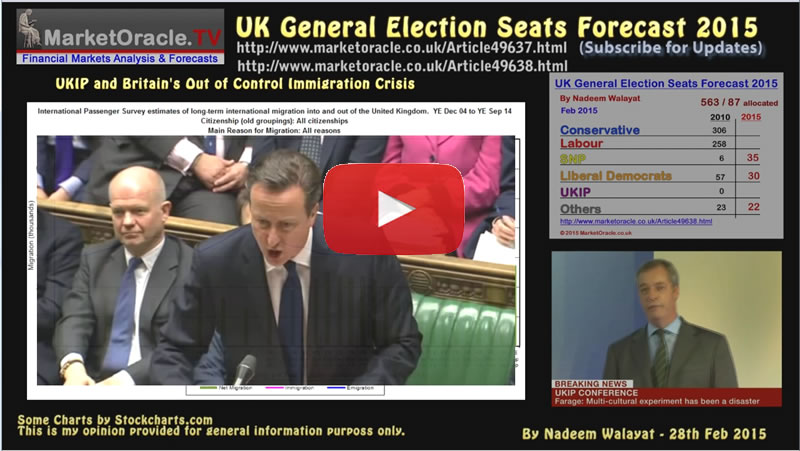
Pulling all of the competing strands together of constituency level election battles favouring the Conservatives and Lib Dems, English fears of an SNP catastrophe and allowing for opinion polls that are skewed towards maximum uncertainty probably more for effect rather than probability, and of course house prices wealth effect as being a focused economic indicator. Then my view remains consistent as of 28th February for the probable outcome for a continuation of the Coalition government with the Tories on at least 296 seats against Labour on 262 as detailed below.
other significant points of difference are on how well the SNP and how badly the Lib Dems will do, as I expect the SNP to win approx 35 seats against pollster expectations of 54, and Lib Dems at least 30 seats against pollsters forecasting 24.
- 28 Feb 2015 - UK General Election 2015 Seats Forecast - Who Will Win?
- 28 Feb 2015 - UK General Election 2015 - Forecasting Seats for SNP, LIb-Dems, UKIP and Others
UK General Election May 2015 Forecast Conclusion
My forecast conclusion is for the Conservatives to win 296 seats at the May 7th general election, Labour 2nd on 262 seats, with the full seats per political party breakdown as follows:
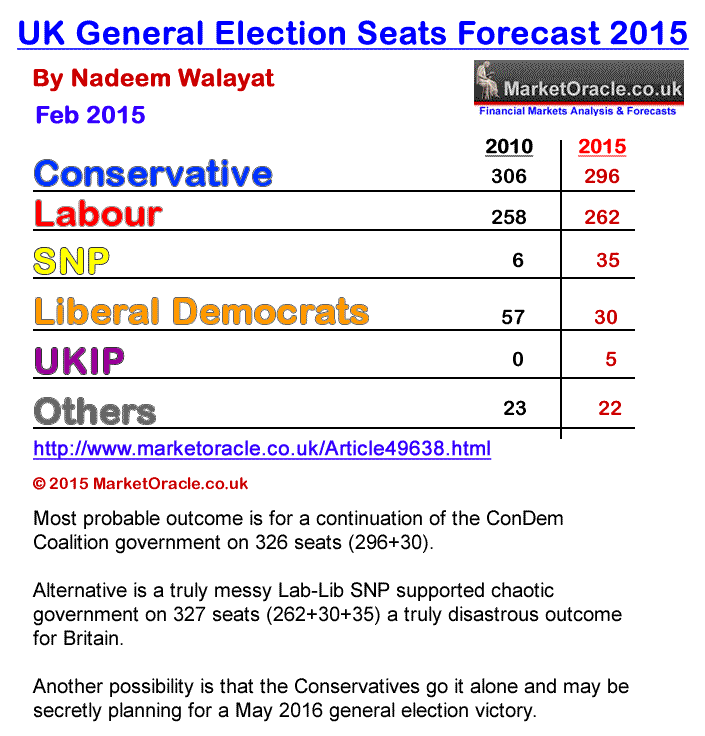
Therefore the most probable outcome is for a continuation of the ConDem Coalition government on 326 seats (296+30) where any shortfall would likely find support from the DUP's 8 seats.
The alternative is for a truly messy Lab-Lib SNP supported chaotic government on 327 seats (262+30+35) which in my opinion would be a truly disastrous outcome for Britain, nearly as bad as if Scotland had voted for independence last September.
Another possibility is that should the Conservatives do better than forecast i.e. secure over 300 seats but still fail to win an overall majority, then they may chose to go it alone with the plan to work towards winning a May 2016 general election.
The bottom line is that the opinion polls do not reflect how people will actually vote on May 7th when they are faced with a stark choice of steady as she goes ConDem government or take a huge gamble on Ed Milliband's Labour party. So in my opinion several millions of voters will chose to play it safe with ConDem which thus is the most probable outcome.
Also available a youtube video version of my forecast:
The bottom line is that Britain's voters are not stupid, they have not forgotten that the last Labour government passed on an economy that was literally teetering on the edge of collapse and that 4 of the past 5 years of pain are as a consequence of attempting to deal with the last Labour governments debt crisis, albeit with a mixed results with the work perhaps only 1/3rd done.
"When I arrived at my desk on the very first day as chief secretary, I found a letter from the previous chief secretary to give me some advice, I assumed, on how I conduct myself over the months ahead.
"Unfortunately, when I opened it, it was a one-sentence letter which simply said 'Dear chief secretary, I'm afraid to tell you there's no money left,' which was honest but slightly less helpful advice than I had been expecting," - David Laws, May 2010
"Dear Chief of Secretary
I'm afraid there is no money. Kind regards - and good luck!
Liam Byrne" - May 2010
Nevertheless, today's UK economy when compared against virtually every other major western nation on most economic measures is on a far more positive footing and trend trajectory that many years from now with the benefit of hindsight will be seen as having been at the beginnings of a 7 year long economic boom. Many of Britain's hard working voters will recall come election day of where the UK economy was in 2010 and to where it has arrived today and thus the election outcome will not be as close as the opinion polls suggest despite millions of Labour vested interested voters parked on benefits for life, the public sector paper pushers and not forgetting Labours recent 4 million imported voters, where should out of control immigration continue over the next 5 years then that virtually ensures a Labour 2020 election victory.
Therefore come May 8th virtually all pollsters will have egg on their faces as the mainstream media will have flushed untold millions down the drain on commissioning opinion polls that turned out to be WRONG just as the polls were wrong in the run up to the Scottish referendum that was never a 50/50 proposition which at the time I concluded was mainly so as to allow pollsters to sell opinion polls and the mainstream press to sell copy and so it is the case with today's election campaign.
UK Saved From I.S. Threat But Scottish Independence Nightmare is Not Over!
There is another reason as well for why the polls were so close and that is one of SALES, the polling industry SELLING a tight election so that the gullible mainstream press would buy their polling services. Therefore painting a picture of a tight race by manipulating the data will have turned out to be a huge money spinner for the polling agencies.
My article concluded in the most probable forecast for the outcome of the result would be for at least show a 10% gap between NO and YES, and definitely not reflective of the mass hysteria.
Therefore the most probable outcome is inline with the polling ranges of before the YES campaigns intimidation and fear phase began to play a prominent role in the frenzy of campaigning of September that rather than a 50/50 tight race is more probably going to result in at least a 55% NO vote victory, and I would not be surprised if the NO vote even breaks above 60%!
Ensure you are subscribed to my always free newsletter for continuing in-depth analysis and concluding trend forecasts.
Source and Comments: http://www.marketoracle.co.uk/Article50492.html
By Nadeem Walayat
Copyright © 2005-2015 Marketoracle.co.uk (Market Oracle Ltd). All rights reserved.
Nadeem Walayat has over 25 years experience of trading derivatives, portfolio management and analysing the financial markets, including one of few who both anticipated and Beat the 1987 Crash. Nadeem's forward looking analysis focuses on UK inflation, economy, interest rates and housing market. He is the author of five ebook's in the The Inflation Mega-Trend and Stocks Stealth Bull Market series that can be downloaded for Free.
 Nadeem is the Editor of The Market Oracle, a FREE Daily Financial Markets Analysis & Forecasting online publication that presents in-depth analysis from over 1000 experienced analysts on a range of views of the probable direction of the financial markets, thus enabling our readers to arrive at an informed opinion on future market direction. http://www.marketoracle.co.uk
Disclaimer: The above is a matter of opinion provided for general information purposes only and is not intended as investment advice. Information and analysis above are derived from sources and utilising methods believed to be reliable, but we cannot accept responsibility for any trading losses you may incur as a result of this analysis. Individuals should consult with their personal financial advisors before engaging in any trading activities.
Nadeem Walayat Archive |
© 2005-2022 http://www.MarketOracle.co.uk - The Market Oracle is a FREE Daily Financial Markets Analysis & Forecasting online publication.


