China’s Whacky Stock Market: How Long Can They Keep This Up?
Stock-Markets / Stock Markets 2015 Apr 28, 2015 - 03:34 PM GMTBy: Harry_Dent
 On April 16, the Shanghai Composite stock index rose 4.4% and Hong Kong’s market went up 7.9%.
The next day, China’s exports got reported down 15% year-over-year… while the stock index rose another 2.9%, crossing 4,300. The news hasn’t changed, but now it’s over 4,500!
Is that whacky or what?
Exports count for anywhere between 35% to 50% of China’s GDP. Just think of all the made-in-China gizmos and gadgets you might have in your own household! For them, a 15% drop is a big deal.
They’re the largest manufacturing and export operation in the world today. That means you also have to consider all the emerging countries exporting raw materials to China to feed this operation.
With demand dropping over most of the world, this is bad news for the entire global economy.
The truth of it is that I’ve used China’s stock market as a leading indicator for how the global economy is fairing for a few years. It’s been the worst performer of any major country since February of 2010 when a short and feeble bounce ended as the rest of the world continued up.
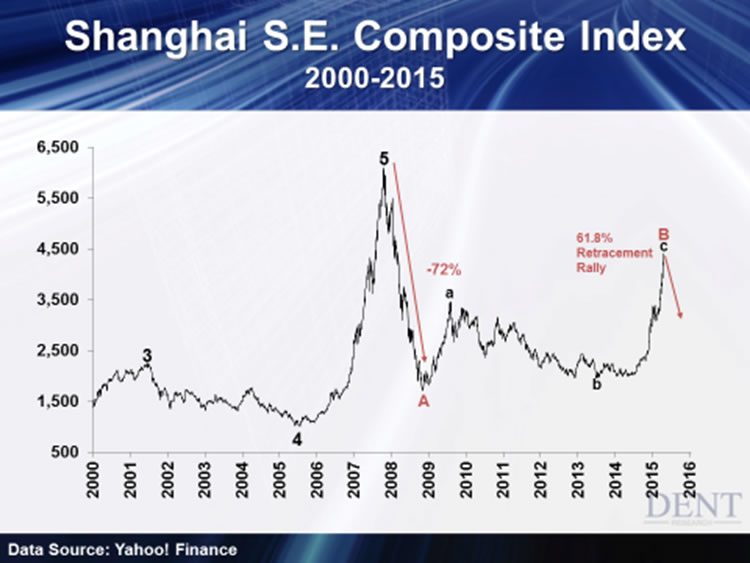
But since mid-2014 we have a new “junior” bubble that’s going exponential like the last one, though that one was bigger:

As you can see, that bubble just lasted a little over two years, going up six times from mid-2005 to late 2007. Then, it crashed 72% in just one year.
I’ve said ever since that was a classic long-term 5th wave bubble top — the kind that will not be exceeded for decades, if ever.
Now, in a period of worsening news for the Chinese economy, we have this current last-ditch “mini” bubble.
After nearly retesting its 2008 lows, the Shanghai Composite has doubled in less than a year. The Chinese most like to speculate in Hong Kong’s Hang Seng index, and that’s gone up almost 5,000 points to 28,433 (as of today) just since March.
It’s the same moronic bubble logic in our own markets!
The “strengthening” economy isn’t what’s driving this. It’s the fact that Chinese investors have suddenly shifted to speculating in stocks, now that real estate has started to fall over the last several months.
This is the opposite of what U.S. investors did in 2000. When tech stocks started going down, they immediately switched to speculating in real estate.
But the logic is fundamentally the same. Stocks to real estate, real estate to stocks… bubble after bubble, we’re always idiots. We never want the bubble to end.
The thing about the U.S., however, is that the fundamental trends in demographics and interest rates still favored real estate for years after 2000. In that case we weren’t building a house on a bed of sand, there was a firm foundation supporting it!
But in China, growth and GDP continue to decelerate. The median price/earnings (P/E) ratio in China’s Shanghai Composite is now 44. Compare that to the S&P 500’s P/E ratio of 20!
Tech stocks in China, of course, aren’t as high a percentage of its stock market as in the U.S… but they’re much more overvalued, putting them at even greater disparity than U.S. tech stocks, especially after Alibaba’s IPO in September.
Adam recently commented on how the run up in Chinese stocks is a result of the rapid rise in new brokerage accounts. Might sound okay, if two-thirds of those people didn’t have less than a high school education! It’s a classic case of the dumb money piling in right at the end!
What’s worse is that the Chinese government is encouraging this stock bubble to help offset the decline of the real estate bubble, which is much more extreme than the stock one.
How naïve to think you can let the greatest bubble in real estate (where the Chinese have the majority of their wealth) in modern history decline, and have a bubble in stocks (a very small percentage of their wealth) make up for it?
That’s why bubble logic is so incredible. It’s where human beings, the smartest species by far on the planet, display their immense capacity for stupidity.
If you look back to the Shanghai Composite chart above, I see this rally as the final wave of a “B” wave or bear market rally — not anywhere close to a new bull market.
Sure, it recently broke through a Fibonacci resistance level of 4,400, which means it’ll likely climb higher from here… but for how much longer?
Harry
Follow me on Twitter @HarryDentjr
Harry studied economics in college in the ’70s, but found it vague and inconclusive. He became so disillusioned by the state of the profession that he turned his back on it. Instead, he threw himself into the burgeoning New Science of Finance, which married economic research and market research and encompassed identifying and studying demographic trends, business cycles, consumers’ purchasing power and many, many other trends that empowered him to forecast economic and market changes.
Copyright © 2015 Harry Dent- All Rights Reserved Disclaimer: The above is a matter of opinion provided for general information purposes only and is not intended as investment advice. Information and analysis above are derived from sources and utilising methods believed to be reliable, but we cannot accept responsibility for any losses you may incur as a result of this analysis. Individuals should consult with their personal financial advisors.
© 2005-2022 http://www.MarketOracle.co.uk - The Market Oracle is a FREE Daily Financial Markets Analysis & Forecasting online publication.


