Stock Market SPX Index at Resistance
Stock-Markets / Stock Markets 2015 Apr 27, 2015 - 07:52 AM GMTBy: Andre_Gratian
 Current Position of the Market
SPX: Long-term trend - Bull Market
Intermediate trend - Is the 7-yr cycle sketching an important top?
Analysis of the short-term trend is done on a daily basis with the help of hourly charts. They are important adjuncts to the analysis of daily and weekly charts which ultimately indicate the course of longer market trends.
SPX AT RESISTANCE
Market Overview
...several cycle analysts are calling for the bottom of a cycle around 4/17-20.
Apparently this cycle fulfilled its potential on the downside as well as on the upside. After it had made its low precisely on the projected date, it provided upside pressure all of last week, propelling a reluctant SPX to a new high twice -- the first time on Thursday with a reading of 2120.49 (close 2112.93) and the second on Friday when it reached a little higher to 2120.92 (with a close at 2117.89).
It's obvious that the index has strong overhead resistance at this level, but it will take another day or so to decide if it is able to penetrate it. On the P&F chart, it is possible to find counts which have been taken from various points on the chart, all of which with projections to 2120/2122. So it is not surprising to see this index attract selling at this level.
The Nasdaq 100 was the star of all the indexes, making another new bull market high of 4543.64 and approaching its 3/19/2000 high of 4816.35. Do you suppose it intends to challenge that high? Well, perhaps not right away! It is interesting to note that the index created what could very well be an exhaustion gap at Friday's opening. What is even more interesting is that every one of the 7 important short-term tops since the beginning of 2014 ended with an exhaustion gap! Will this one be number 8???
SPX is resisting going higher and NDX may have made an exhaustion gap on Friday. Perhaps this is telling us something about the market's short-term direction! We'll find out next week.
Indicators Survey
In spite of the index being in an uptrend for 4 consecutive weeks, the weekly MACD remains in a bearish configuration with negative divergence. The SRSI managed to eke out a new high, but the pattern looks sluggish instead of showing strong upside momentum.
The daily MACD is forcing itself to remain in an uptrend since its low at the beginning of April and is exhibiting the weakest pattern with negative divergence since the beginning of the year.
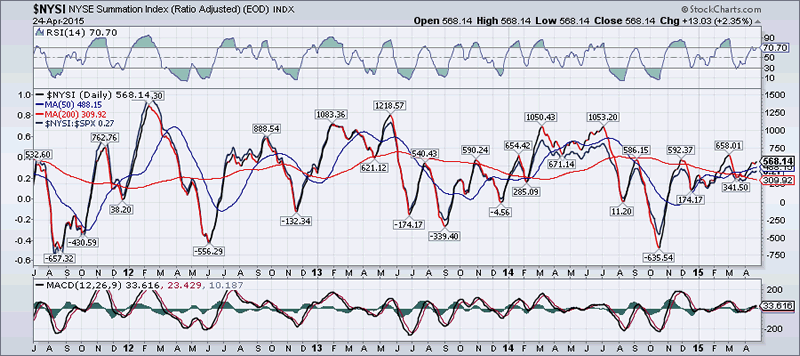
I keep reading how bullish the cumulative A/D line is, making new highs almost every day. But this index is notorious for being misleading. The Summation Index (chart below courtesy of StockChart.com) is far more reliable and, as you can see below, it is not exactly making new highs every day! In fact, although it is in an uptrend since its March 17 low, this is the weakest looking uptrend in quite a while whether you are observing the short-term or the intermediate term trend. One should also take note of its MACD and compare what it has done since the beginning of the year with the pattern it made from April to July of last year - and what followed!
The SPX 1X P&F chart has completed a short-term phase count which points to a projection of 2120/2122. This deserves at least a pause in the uptrend, and perhaps more. Its refusal to go beyond 2120 over the past two days has created a small congestion pattern which measures about 20 points across. This could result in more gains if it turns out to be accumulation, or the reverse if it is distribution instead. (Note: that does not mean that SPX can necessarily go to 1240 if it breaks above 2120, but it could use some of that count to go a few points higher.) The rise of the index to its former high has not altered the possibility that the 3X P&F is making a large rounding top pattern.
Chart Analysis
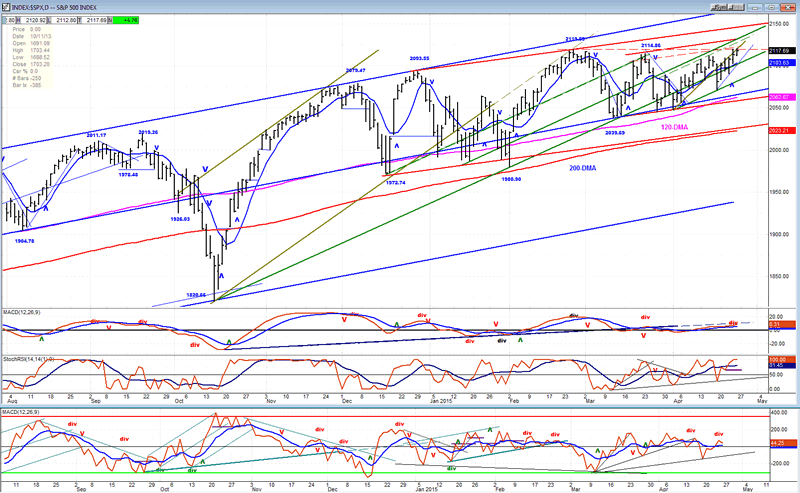
Let's start our analysis of the daily chart of the SPX (courtesy of QCharts.com, as well as others below) by focusing on the wide blue channel whose top line is formed by connecting the 7/07/14 top to the 2093 high and extending it. The bottom channel line is a parallel to this line drawn across the October low. The blue trend line in the middle is another parallel drawn across the 1904 low. That middle line serves to divide the larger channel in two segments which are approximately equal in width. That line has also served as support for the last three March short-term bottoms. We can also see that since the October low, the trading has been pretty much confined to the upper section.
Since the 2093 high, every subsequent top has reversed farther and farther from the blue trend line, creating a deceleration process. With the SPX making a fractional new high on Friday, it is possible that if more strength follows, it will surpass its 2120 high and continue to rise to the blue line and perhaps even beyond if there is a new buying surge in the market. That, of course would be bullish. The alternative would be that it goes the other way and breaks below the middle blue line. If it does that, it would most likely find some support, at least temporarily, on the lower red channel line which corresponds with the 200 DMA.
That's the big picture! If the sideways trend of the last two weeks was a consolidation pattern and we rise above the red trend line, we know that we are still in a strong bull market which had only a little rest period. If, on the other hand, we start to roll over from here and drop below the middle blue line, there is a good chance that we are starting an intermediate downtrend which will take us down to the lower blue channel line. We don't have to speculate beyond these two possible courses of action. We can just wait to see which of the two materializes.
Let's now look at the indicators at the bottom of the chart and see what they are telling us. Considering the fact that the middle one (SRSI) is overbought and the other two are anything but bullish, I suspect that we are getting ready to make another trip downward, perhaps to the middle blue line. My observations in the Market Overview and Indicators Survey increase the odds that this is about to happen. The next few trading days should inform us further about what to expect from the market.
One more thing should be pointed out on this chart, and that is the green trend line which connects the October low with two more subsequent lows: the first at 1990, and the next at 2040. Although it does not produce a channel, I believe it represents and determines the current trend of the index. There are three points in alignment on that trend line, which validates it . The fact that twice it was breached, but both times the index was able to rally above it, attests to the importance which the bulls attribute to it. Notice how a parallel drawn from the 1972 low prevented the index from going higher at 2114, and another from the 1988 low is also offering resistance to the current trend. We'll look at this more closely next, on the hourly chart.
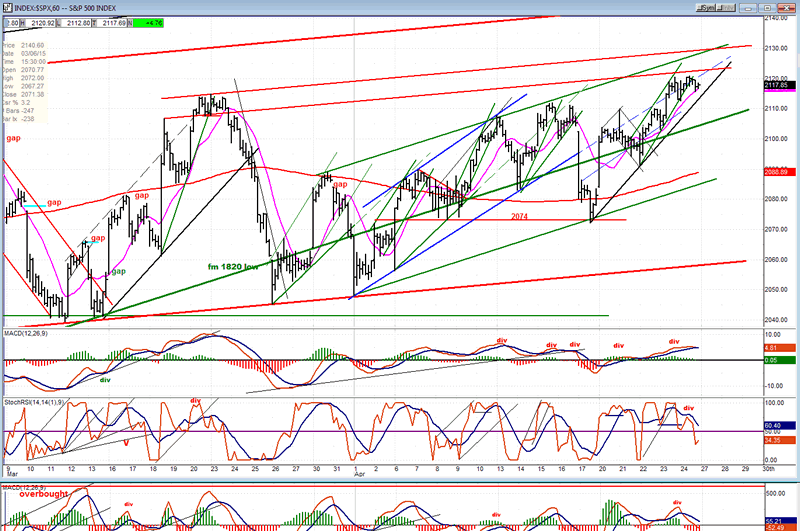
On the hourly chart, we'll first focus on the red channel inside the blue channel, which was mentioned above. That channel (top and bottom lines are heavier) which continues to hold prices, constitutes a deceleration of the primary (blue) trend, and if the SPX cannot even penetrate the red trend lines which are directly above it, it will suggest that even more deceleration is taking place. The bottom line of the red channel has already held prices on four separate occasions. Needless to say if, at some point, that line is penetrated decisively, it will strongly suggest that more than short-term market weakness lies ahead.
Now, let's continue with the analysis of the green trend line from the October low which is heavier than the other ones on this chart. It has been breached not twice, but three times, but a resilient SPX has managed to get back above it each time. Exact parallels above and below that trend line are currently delineating the short-term trend of the index. If SPX cannot rise to the top green line again, it could be susceptible to breaking below the lower channel line, and this could lead to a decline to the bottom of the red channel.
Of course, a strong break out of the top green and red lines would suggest a resurgence of strength in the market. But what are the odds that this will happen? Look at the indicators at the bottom. If you thought that the daily ones looked bad, these look even worse. All three show negative divergence and two of them are already in a downtrend. It's unlikely that SPX can break out with this kind of pattern in the oscillators without correcting, first.
The following indexes have proven themselves to be market leaders. Since the market appears to be at an inflection point, they should be carefully followed for potential signs of further deterioration.
XLF
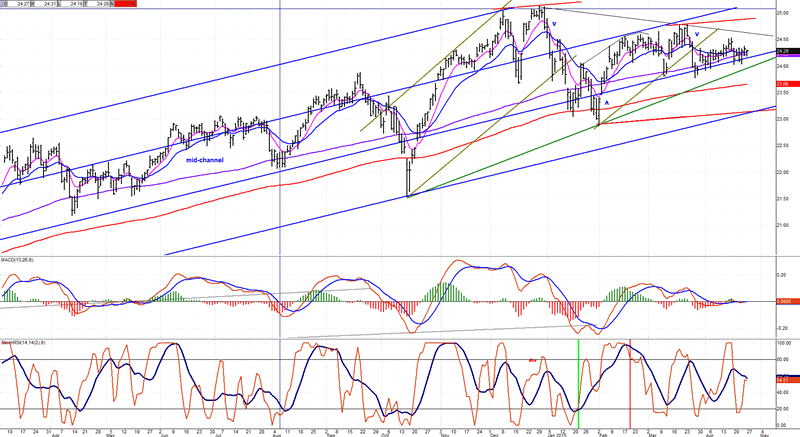
XLF is one of the top leading indicators which warn of important market tops. It has done so repeatedly historically -- most recently when it warned about the approach of the 2007-2009 bear market. This index made its high on 12/29 at 25.14 and was followed by a fairly steep correction to 22.89. It then made an attempt at returning to the high which failed at 24.78 on 3/23. Since then, XLF has gone sideways but remained below its secondary high.
This is bearish divergence to the SPX and a sustained drop below 24.00 would strengthen even more the case for a significant market correction directly ahead.
TRAN
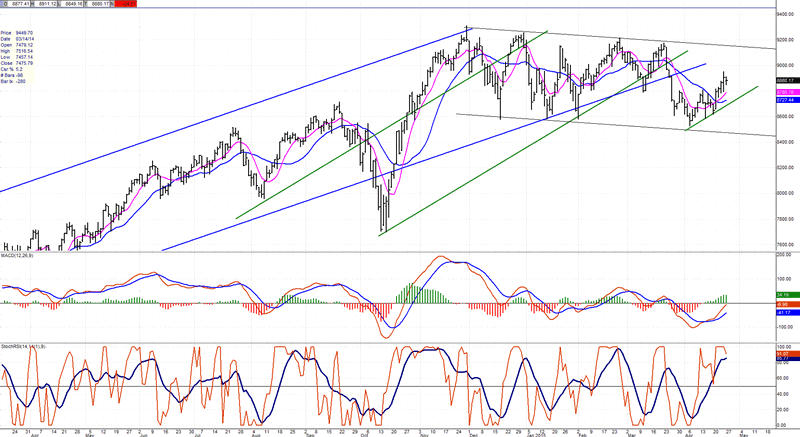
TRAN also has a reputation as a market leader. It made its high on 11/28/14 at 9310.22 and has drifted down to Friday's close of 8904 after a correction low of 8527 in an orderly series of lower highs and lower lows. This has taken it outside an intermediate channel from 11/12.
It is currently attempting to restore its former uptrend. If it fails and makes a new low, it will add downward pressure on the overall market.
SMH
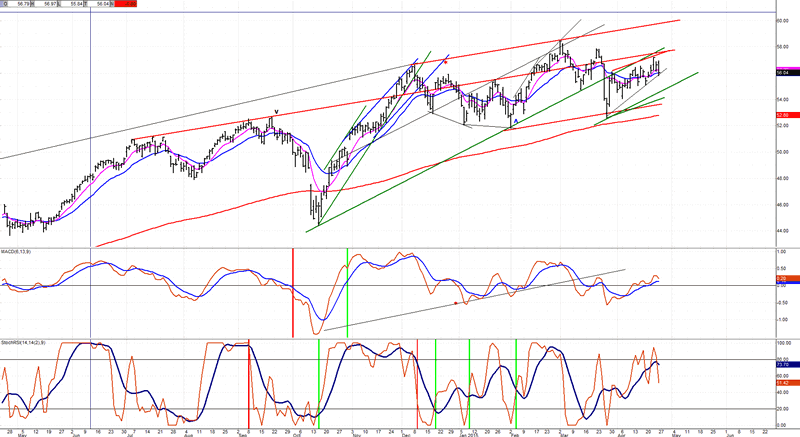
The semi-conductor index often starts to weaken ahead of the general market. This may be what SMH is currently doing by not following NDX and SPX to new all-time highs, but more time is required to be sure. This index is not always in lockstep with the major averages. Note, however that it has broken its trend line from the October low and that it is presently back-testing it. What follows from here on will be important. It deserves to be closely watched.
IWM
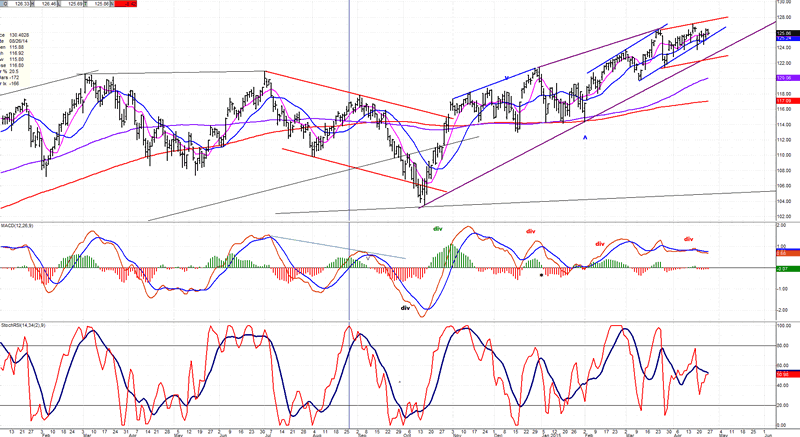
Finally, IWM's action is as important as any to watch for a potential market top. The wedge pattern that has formed since the October low is bearish and the action since late March suggests that it may be coming to an end. Note that it did not participate in last week's exuberance.
A break of the lower wedge trend line would proably sugget a market correction.
Weakness in these four indices would bring pressure on the market that would be difficult to ignore. It would be a question of whether it ends in just a few days or continues for a couple of weeks or longer.
UUP
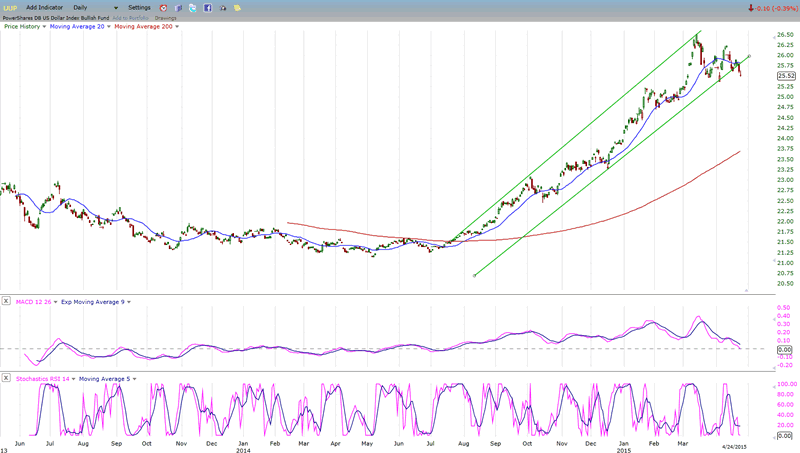
UUP is still consolidating after its sharp run-up. When the consolidation is over, the index is expected to make new highs. The potential P&F count has not yet been achieved.
GLD
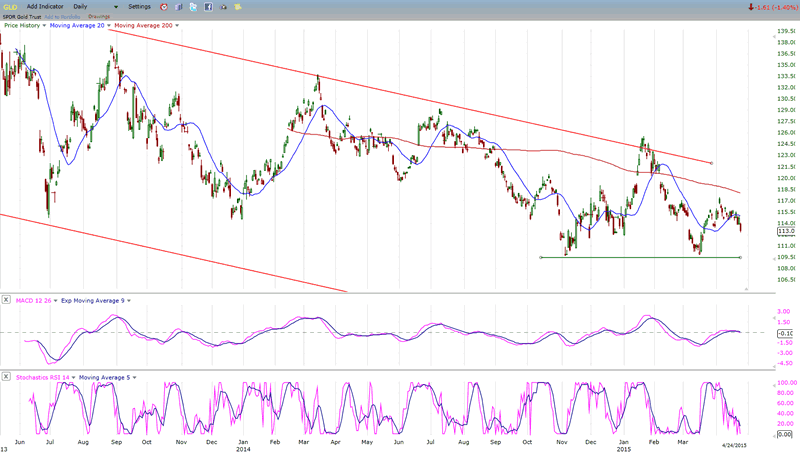
GLD will be subjected to pressures which will weigh on its price over the next few weeks.
First, the 25-wk cycle is due to make its low in early May. Next, when the dollar continues its uptrend, it should depress gold prices. And finally, some analysts see even more important cyclical pressures continuing into June or July. This could drop GLD down to the 100 level.
USO
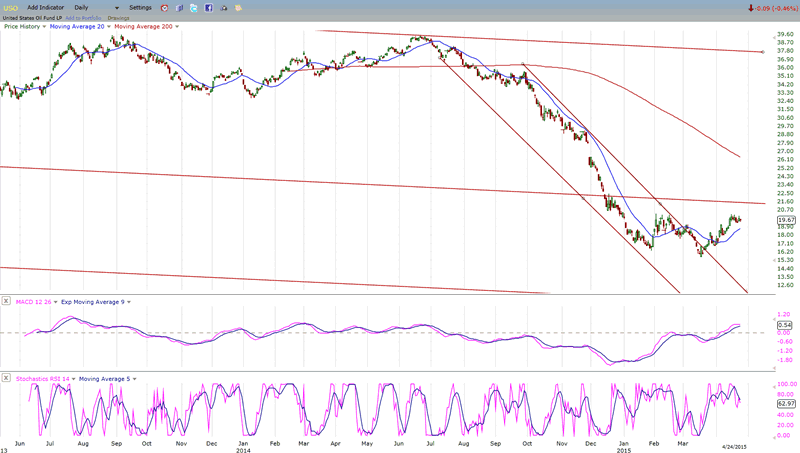
If my P&F count is correct, USO may be close to resuming its downtrend toward its 13 projection. This would occur in sync with the dollar rising to its projection trget as well.
Summary
Last week, SPX tried to make a new high but was restricted by heavy resistance to only fractional gains which immediately attracted sellers. The daily and hourly indicators make it questionable that it will succeed in going much higher in the near future and it may be forced to undergo at least a minor correction, first. It is also not clear whether or not, if it tries again later, it will be any more successful.
Until some real strength is witnessed in the entire market, at best the rounding top pattern is likely to continue forming. But it is also possible that, instead (and before too long), enough weakness is experienced to take SPX below 2040 in what would be the start of an intermediate term correction that could bring much lower prices.
FREE TRIAL SUBSCRIPTION
If precision in market timing for all time framesis something that you find important, you should
Consider taking a trial subscription to my service. It is free, and you will have four weeks to evaluate its worth. It embodies many years of research with the eventual goal of understanding as perfectly as possible how the market functions. I believe that I have achieved this goal.
For a FREE 4-week trial, Send an email to: info@marketurningpoints.com
For further subscription options, payment plans, and for important general information, I encourage
you to visit my website at www.marketurningpoints.com. It contains summaries of my background, my
investment and trading strategies, and my unique method of intra-day communication with
subscribers. I have also started an archive of former newsletters so that you can not only evaluate past performance, but also be aware of the increasing accuracy of forecasts.
Disclaimer - The above comments about the financial markets are based purely on what I consider to be sound technical analysis principles uncompromised by fundamental considerations. They represent my own opinion and are not meant to be construed as trading or investment advice, but are offered as an analytical point of view which might be of interest to those who follow stock market cycles and technical analysis.
Andre Gratian Archive |
© 2005-2022 http://www.MarketOracle.co.uk - The Market Oracle is a FREE Daily Financial Markets Analysis & Forecasting online publication.


