


Stocks Bull Market Looks to Resume
Stock-Markets / Stock Markets 2015 Apr 25, 2015 - 05:46 PM GMTBy: Tony_Caldaro

 The market started the week at SPX 2081, gapped up on Monday/Tuesday hitting 2110, pulled back to 2091 by Wednesday, then with a gap up on Friday hit a new high at 2121. For the week the SPX/DOW gained 1.6%, the NDX/NAZ gained 3.8%, and the DJ World index gained 1.6%. Economic reports were sparse, and again biased to the upside. On the uptick: the FHFA, existing home sales, durable goods orders and the WLEI. On the downtick: new homes sales plus weekly jobless claims were higher. Next week will be highlighted by Q1 GDP, the FOMC meeting, and PCE prices.
LONG TERM: bull market
After making what we feel is an important Major wave 4 low at SPX 1981 in early February, the market confirmed an uptrend and made new highs at SPX 2120 by late February. After that the market spent the next two months in a choppy sideways pattern between SPX 2040 and 2115, until late this week. What is interesting is despite the sideways activity the market never once confirmed a downtrend. In other words, the uptrend that started in early February is still underway. More on this below.
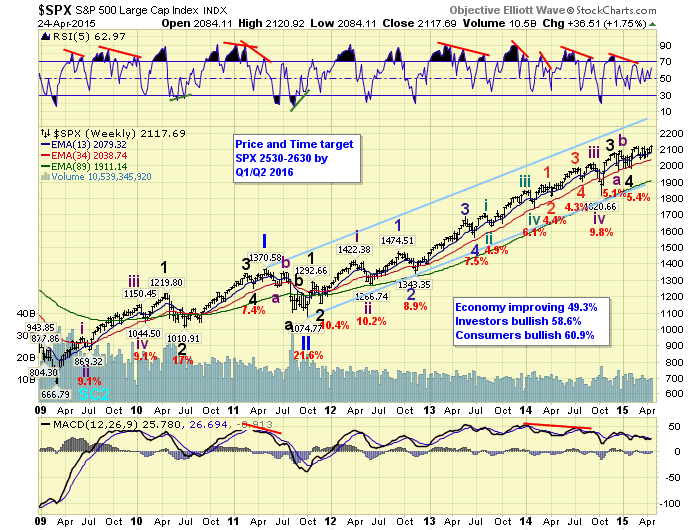
We continue to label this bull market as Cycle wave [1] consisting of five Primary waves. Primary waves I and II completed in 2011, and Primary wave III has been underway since then. Primary I rose in five Major waves with a subdividing Major wave 1 and simple Major waves 3 and 5. Primary III is also rising in five Major waves, but Major 1 was simple, Major 3 subdivided quite a bit, and Major 5 is expected to subdivide as well. When Primary III concludes there will be a steep Primary IV correction, probably in 2016, then a rising Primary V to end the bull market, probably by 2017. Our target for Primary III remains SPX 2530-2630 by Q1/Q2 2016.
MEDIUM TERM: uptrend
After the market made new highs in late-February at SPX 2120 and started to pullback, we expected a small decline, about 5%, and then the uptrend to resume. After the market declined to SPX 2040 by early March, rallied to 2115 by mid March, and then declined to 2046/48 by late March we thought the pullback might be over. The rally off the SPX 2048 low started off well but then got quite choppy. This led us to believe that the market would need to retest the SPX 2040’s again, or worse case the 2019 pivot, before the pullback/correction ended. We even went so far as to post five potential counts to cover all possibilities, even though the two highest probability counts met the above support parameters. The market nonetheless chopped its way to new highs on Friday.
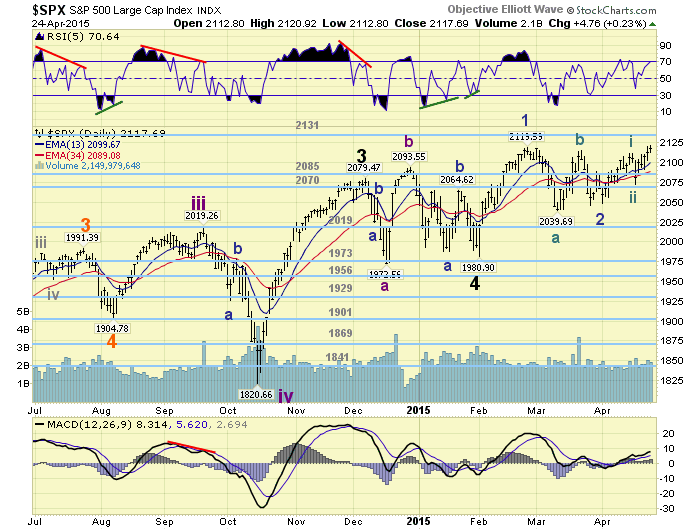
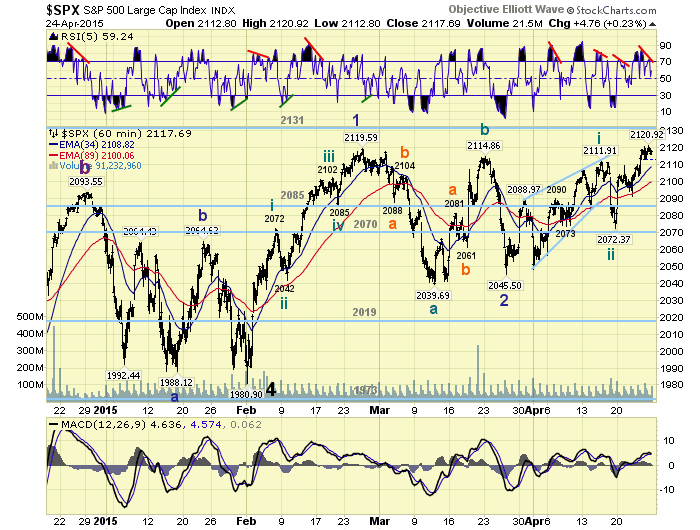
With the SPX/NAZ/NDX/NYSE/WLSH indices all making new uptrend highs, and the NYAD making new highs as well, it is time to find some sort of impulsive wave out of this months choppy activity. Since Major wave 4 ended in a failed flat: 1973-2094-1981, Minor wave 2 could have also ended in a failed flat: 2040-2115-2046. On Thursday we posted a potential count that was mentioned in our OEW group: a leading diagonal. This count, which was mentioned by Bill C., suggests a leading diagonal from SPX 2046: 2089-2048-2108-2083-2112. This could be labeled Minute i of Minor 3, and the pullback that followed to SPX 2072 Minute ii. After that Minute iii kicked off, and has thus far risen: 2110-2091-2121. This count would not only explain the choppy activity over the past month, but also suggests some explosive upside ahead. Medium term support is at the 2085 and 2070 pivots, with resistance at the 2131 and 2198 pivots.
SHORT TERM
After Thursday/Friday’s market activity we have dropped the three alternate counts we had only given a 10% probability. The two remaining: a Minor 1 high at SPX 2120 if the uptrend remains, and an Intermediate wave i high at SPX 2120 if we confirm a downtrend. Since the uptrend appears to be extending we are going with Minor wave 1 at SPX 2120, Minor wave 2 at SPX 2046, and Minor wave 3 underway. As long as the OEW 2070 pivot is not broken to the downside the uptrend should extend higher.
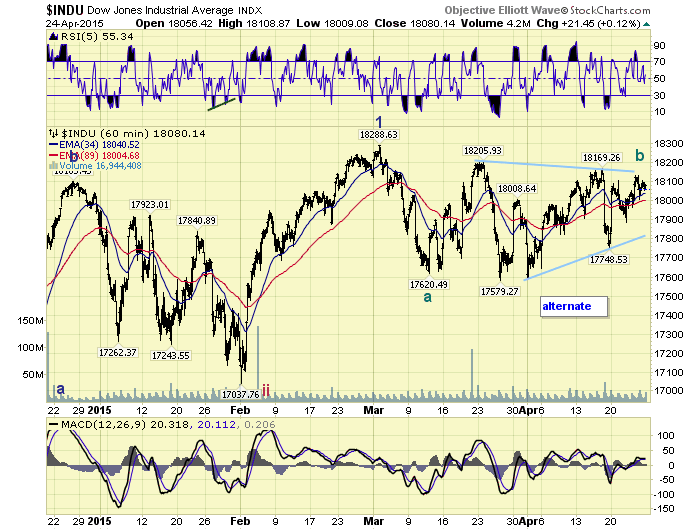
Should the OEW 2070 pivot be broken, then as the DOW charts suggests, at this point, this choppy activity is not over, and a downtrend will likely be underway next. This activity would then favor the Intermediate wave i count noted above. Should the market do move lower we still feel the downside is limited to the SPX 2040’s or worse case the 2019 pivot. Short term support is at SPX 2112/2115 and the 2085 pivot, with resistance at SPX 2121 and the 2131 pivot. Short term momentum ended the week with a negative divergence. Best to your trading this tough market.
FOREIGN MARKETS
The Asian markets were mostly higher for a net gain of 0.5%.
The European markets were all higher for a net gain of 1.6%.
The Commodity equity group were all high gaining 2.8%.
The DJ World index is still in an uptrend and gained 1.6%.
COMMODITIES
Bonds are still uptrending but lost 0.3% on the week.
Crude is also uptrending and lost 0.4% on the week.
Gold is still in an uptrend but lost 2.0% on the week.
The USD appears to be downtrending and lost 0.6% on the week.
NEXT WEEK
Tuesday: Case-Shiller, Consumer confidence, and Senate testimony from FED director Van Der Weide. Wednesday: Q1 GDP (est. +0.75%), Pending home sales and the FOMC concludes. Thursday: weekly Jobless claims, Personal income/spending, PCE prices, the Chicago PMI, and a speech from FED governor Powell. Friday: ISM manufacturing, Construction spending, Consumer sentiment, and Auto sales. Best to your weekend and week!
CHARTS: http://stockcharts.com/public/1269446/tenpp
http://caldaroew.spaces.live.com
After about 40 years of investing in the markets one learns that the markets are constantly changing, not only in price, but in what drives the markets. In the 1960s, the Nifty Fifty were the leaders of the stock market. In the 1970s, stock selection using Technical Analysis was important, as the market stayed with a trading range for the entire decade. In the 1980s, the market finally broke out of it doldrums, as the DOW broke through 1100 in 1982, and launched the greatest bull market on record.
Sharing is an important aspect of a life. Over 100 people have joined our group, from all walks of life, covering twenty three countries across the globe. It's been the most fun I have ever had in the market. Sharing uncommon knowledge, with investors. In hope of aiding them in finding their financial independence.
Copyright © 2015 Tony Caldaro - All Rights Reserved Disclaimer: The above is a matter of opinion provided for general information purposes only and is not intended as investment advice. Information and analysis above are derived from sources and utilising methods believed to be reliable, but we cannot accept responsibility for any losses you may incur as a result of this analysis. Individuals should consult with their personal financial advisors.
Tony Caldaro Archive |
© 2005-2022 http://www.MarketOracle.co.uk - The Market Oracle is a FREE Daily Financial Markets Analysis & Forecasting online publication.