


Sugar Commodity Price Bear Rally
Commodities / Commodities Trading Apr 19, 2015 - 09:59 PM GMTBy: Austin_Galt

 Sugar finally looks to have kicked off its bear rally so let’s quickly revise the situation using the daily and weekly charts.
SUGAR DAILY CHART
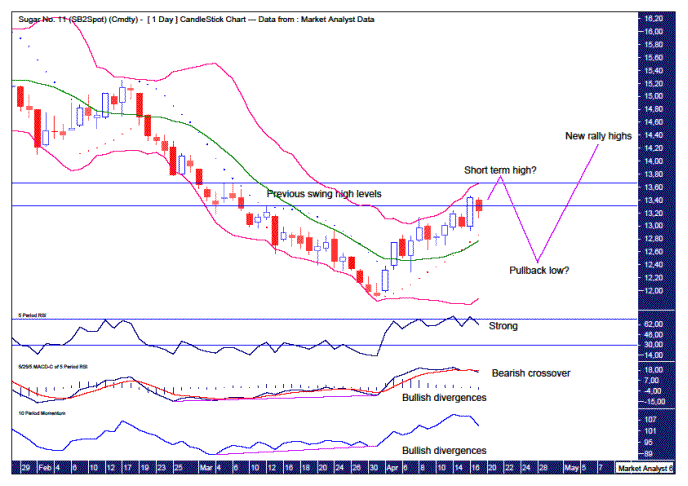
Since the last report price dropped a bit lower than expected. Well, a downtrend is clearly in force so continuing lower wasn’t really a surprise.
As expected, price busting the dots of the Parabolic Stop and Reverse (PSAR) indicator has led to price breaking the short term downtrend. A bullish bias remains in force with the dots underneath price.
I have drawn two horizontal lines which denote previous swing high levels. Price has already taken out the first swing high so a higher high will be in place on the chart. I favour price taking out the second swing high level at US$13.66 before any correction occurs.
Once a short term high is in place then price should come back down to put in a higher low. Fibonacci retracement levels can be used to try and determine where that higher low might be.
The Bollinger Bands show price currently close to the upper band while I favour a higher low to be back near the lower band. Any correction back to the middle band will need to be monitored as price bouncing off that band will indicate strength.
The Relative Strength Indicator (RSI) is looking strong by making new highs in overbought territory. I would like to see the final bear rally high accompanied by a weaker reading.
The Moving Average Convergence Divergence (MACD) and Momentum indicators both show multiple bullish divergences at the recent low while the MACD has just made a bearish crossover so a correction looks like it may be on the cards shortly.
SUGAR WEEKLY CHART
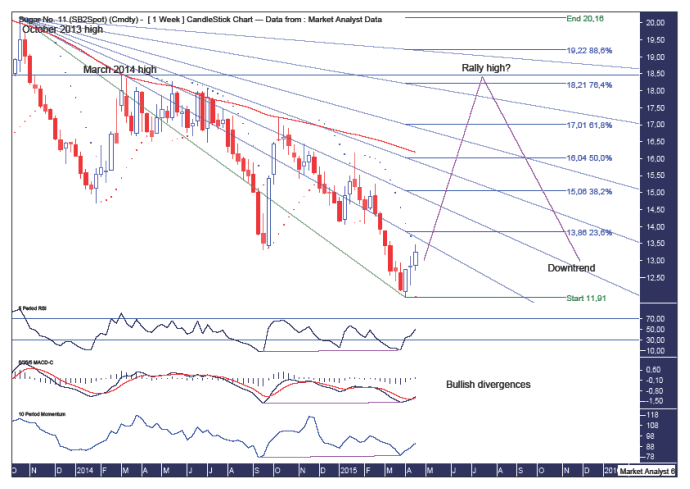
The lower indicators, the RSI, MACD and Momentum, all show a bullish divergence at the recent low and all now appear to be trending up.
The PSAR indicator now has a bullish bias after price busted the dots on the upside last week.
From previous longer term analysis in the article Sugar Price To Sweeten Up, I am expecting a large bear rally that potentially threatens the 2013 high at US$20.16 although price should not trade above that level.
I have added Fibonacci retracement levels of the move down from the October 2013 high to recent low and I expect a rally back to the 76.4% level which stands at US$18.21. This is just below the March 2014 high which is denoted by the horizontal line and price turning down there would create a bearish double top. The 88.6% level at US$19.22 also needs to be kept in mind although I doubt price will trade that high. Let’s see.
I have also drawn a Fibonacci Fan and I favour the 76.4% angle to provide resistance. This angle looks set to be just below the 76.4% retracement level around July this year. The 88.6% angle is another possibility.
I have also added a 100 period moving average which has provided resistance in the past and, while it may do so again here, I favour a more substantial rally.
And once this rally has run its course I favour a move down to new lows. Likely levels for the final bear market low were detailed in the article Sugar Price To Sweeten Up.
Bio
Austin Galt is The Voodoo Analyst. I have studied charts for over 20 years and am currently a private trader. Several years ago I worked as a licensed advisor with a well known Australian stock broker. While there was an abundance of fundamental analysts, there seemed to be a dearth of technical analysts. My aim here is to provide my view of technical analysis that is both intriguing and misunderstood by many. I like to refer to it as the black magic of stock market analysis.
By Austin Galt
Austin Galt is The Voodoo Analyst. I have studied charts for over 20 years and am currently a private trader. Several years ago I worked as a licensed advisor with a well known Australian stock broker. While there was an abundance of fundamental analysts, there seemed to be a dearth of technical analysts. My aim here is to provide my view of technical analysis that is both intriguing and misunderstood by many. I like to refer to it as the black magic of stock market analysis.
Email - info@thevoodooanalyst.com
© 2015 Copyright The Voodoo Analyst - All Rights Reserved
Disclaimer: The above is a matter of opinion provided for general information purposes only and is not intended as investment advice. Information and analysis above are derived from sources and utilising methods believed to be reliable, but we cannot accept responsibility for any losses you may incur as a result of this analysis. Individuals should consult with their personal financial advisors.
Austin Galt Archive |
© 2005-2022 http://www.MarketOracle.co.uk - The Market Oracle is a FREE Daily Financial Markets Analysis & Forecasting online publication.