


Stock Market Going Nowhere Fast
Stock-Markets / Stock Markets 2015 Apr 19, 2015 - 09:48 PM GMT

 SPX
SPX
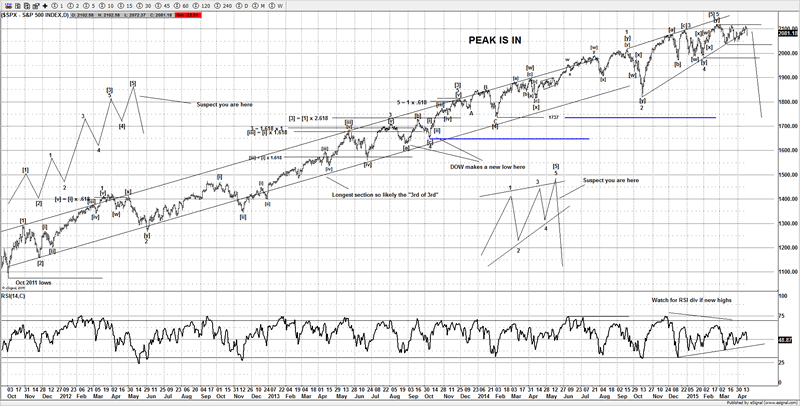
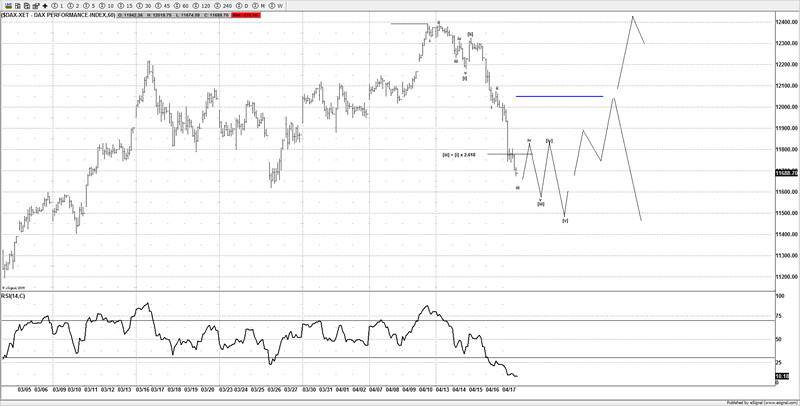
Last week I mentioned the idea of a pullback on the SPX; it appears the bears were in tune with that idea, although it may still see a bit more downside as some of the European markets argue for a bit of weakness, such as the DAX etc. The current idea of seeing a new all time highs is still possible and as many have got bearish again due to Fridays decline, I do wonder if traders are actually looking at the same charts as I am. Whilst Fridays decline was a steep move, the market is still firmly above 2060SPX so I tend to think the bulls still have to upper hand, although until it sees a strong decline under 2040SPX. I still would not rule out the bulls pushing this market higher and seeing 2130SPX.
SPX Chart 1
SPX Chart 1
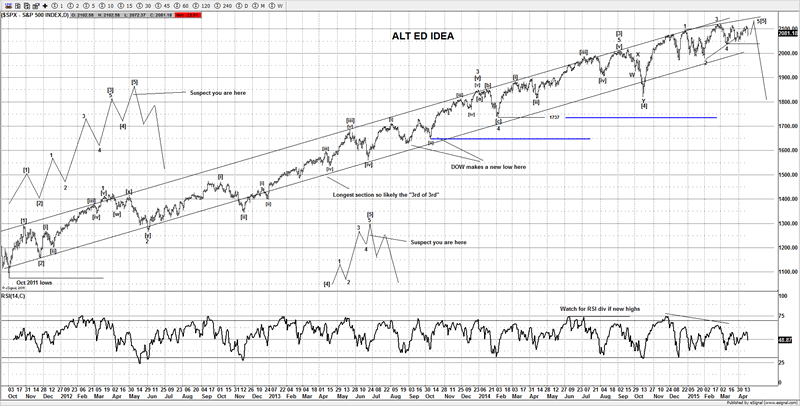
SPX Alt Idea
It's possible to count the move completed from the Oct 2011 lows, but unless the bears do more damage than last week there is still scope for the market to move higher, as the title suggests the markets are "Going Nowhere Fast".
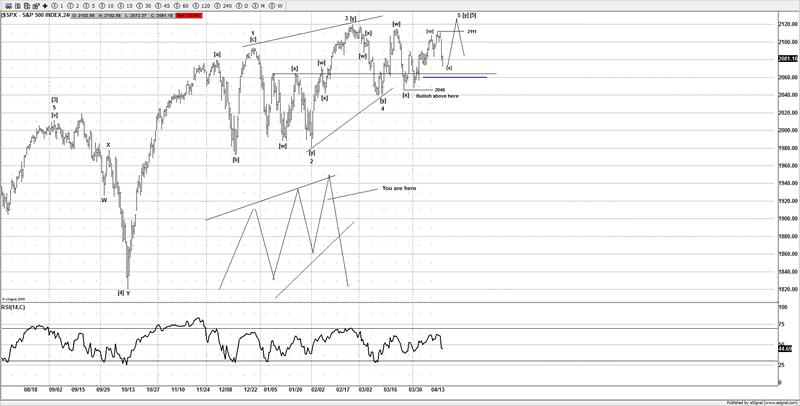
SPX Alternate Chart
Still this alt idea is a possible pattern, the key for the bears is to keep it under last week's high at 2111SPX, if we only see a weak looking bounce that fails to move above 2111SPX then the bulls could be in trouble and the alt idea I am watching potentially becomes the primary idea, but still the bears need to step up and prove themselves, if we are going to see a repeat of the prior fractal then the bears are about to be setup for another short squeeze.
Been Here Before?
SPX Repeating Pattern Chart
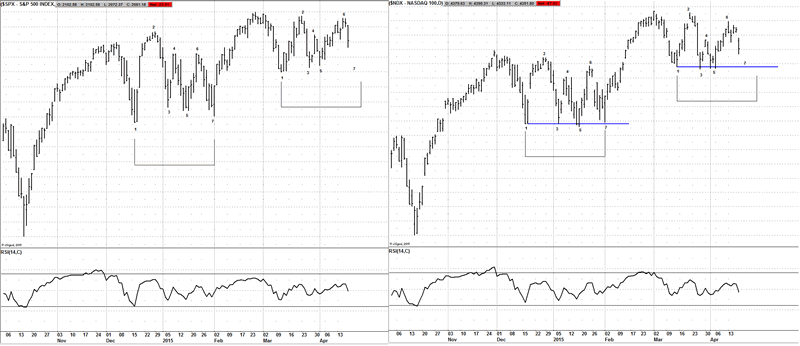
When you take a non-bias look at the current structure it really does look similar the price action we saw around the Jan-Feb 2015 time frame. If the market is in point 7, then I think we should be close to buyers stepping up and supporting the market, there is a lot of support above 2040SPX and I would be surprised if the bears get their way without some reaction from current levels into 2040SPX. Ideally the market has actually put in a short term low, but as I mentioned above there is the possibility the DAX sees a bit more downside. So weakness in the European Globex session could see the ES futures push lower and test the lows on Friday around 2065ES
SPX Chart 5
VIX
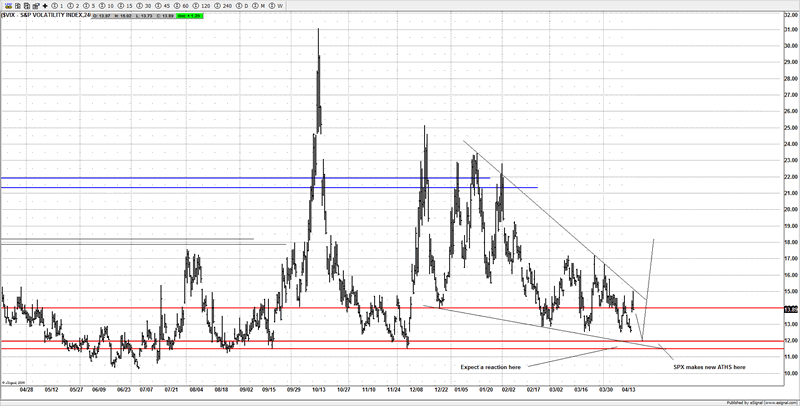
I have been eyeing up a potential target around the 12.00 - 11.50 area for a major low before a larger move to the upside, that in theory should see the SPX move higher and make new all time highs, well that's the ideal scenario.
VIX Chart
Natural Gas
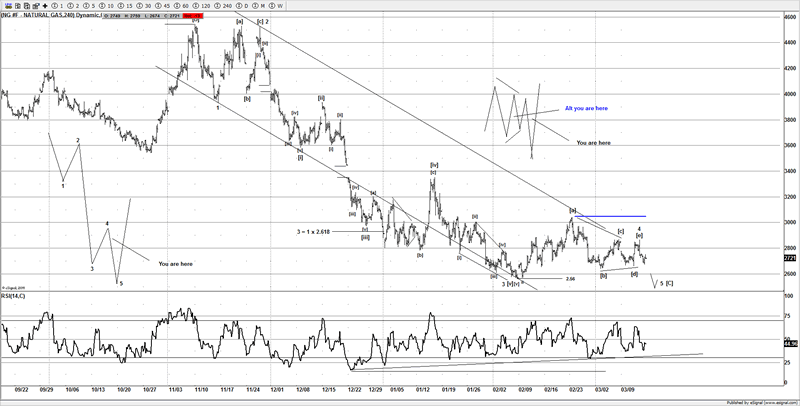
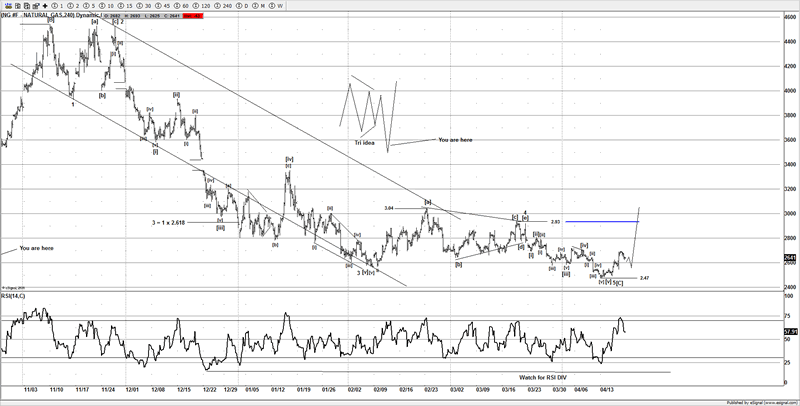
Here at wavepatterntraders we look at over 22 markets on a regular basis, so we are not always about the US markets, we cover a vast amount of markets. One market we have been stalking is Natural Gas, its took its time, but we finally think a major low could be in, with a nice 5 wave advance from the lows, we are looking to buy any corrective pullback. The great thing is the reward is very high, if a major low is in place we would be expecting a lot more upside over the coming months. Readers can look to buy a pullback in 3 waves; your stop needs to be put at the prior swing low (2.47). If you don't have a futures account then you can play this idea by buying the etf UNG. Members already have made some good gains trading the downside into the lows at 2.47 and buying the lows, but we think there plenty more upside to come over the next few weeks. We know it's wrong if it moves below 2.47.
Natural gas Chart 1
Natural Gas Chart 2
GDX
A few weeks back we managed to find a low risk setup for members to get long with minimal risk. With most of the social forums bearish gold stocks, we had different ideas and again looked to fade the crowd, that bet turned out to be a stellar trade for members, with the expected rally now seen, it's now that we are stepping back and looking to evaluate things.
GDX Chart 1
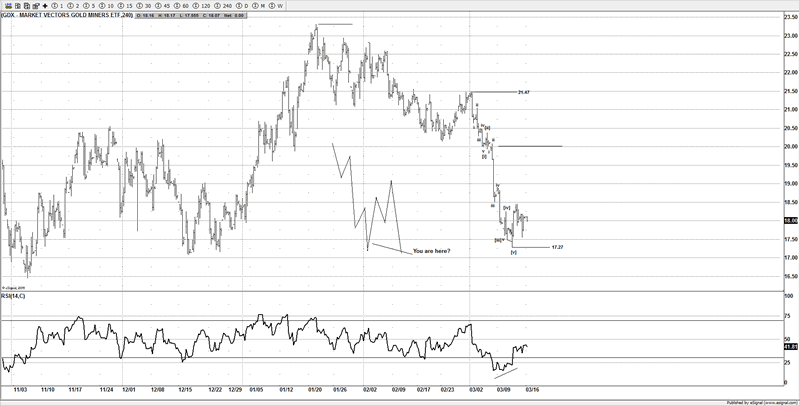
GDX Chart 2
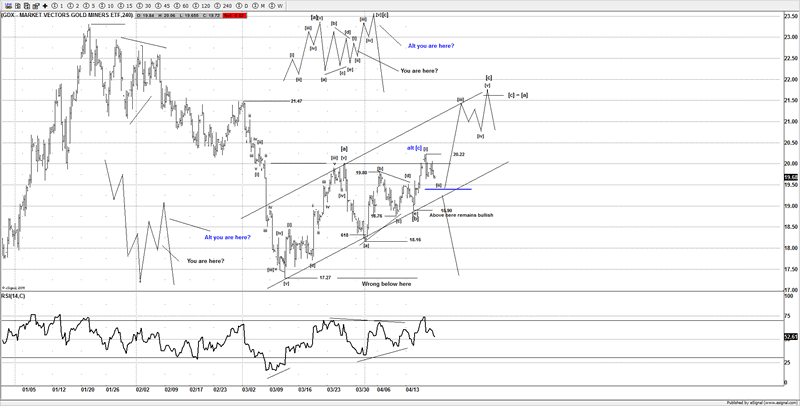
If the pullback can stay above the 19.40 area and in 3 waves then I favor that the bulls can push this higher, there is still scope to see a move towards 21.50. However reviewing some of the major Gold stocks we follow such GG. ABX & NEM suggests the bulls need to be very cautious around this area. The current bounce on those 3 stocks appears to be corrective, so not a good omen for the bulls. If GDX fails to move above 20.22 and we see a strong break under 19.40 then the move from 17.27 is likely over and a move lower and target under 17.00, we still have outstanding targets for the GDX towards 16.00.
Conclusion
Whilst most traders will be focused on the chop and whipsaw on the US markets, we at wavepatterntraders will be focused on other ideas, those that are prepared to look elsewhere may just trade some gems that are not been watched. Decide if you want to be involved in whipsaw or if you want to get on board a trend such as Natural Gas.
Until next time,
Have a profitable week ahead.
Currently we are running a promotion. Sign up within the next 4 weeks and get a 50% reduction off the price of the full monthly package, so you pay $29.00 for the first month then $59.99 each month thereafter. At the registration form please use the promotional code 959815683A to get your discount.
Click here to become a member
You can also follow us on twitter
What do we offer?
Short and long term analysis on US and European markets, various major FX pairs, commodities from Gold and silver to markets like natural gas.
Daily analysis on where I think the market is going with key support and resistance areas, we move and adjust as the market adjusts.
A chat room where members can discuss ideas with me or other members.
Members get to know who is moving the markets in the S&P pits*
*I have permission to post comments from the audio I hear from the S&P pits.
If you looking for quality analysis from someone that actually looks at multiple charts and works hard at providing members information to stay on the right side of the trends and making $$$, why not give the site a trial.
If any of the readers want to see this article in a PDF format.
Please send an e-mail to Enquires@wavepatterntraders.com
Please put in the header PDF, or make it known that you want to be added to the mailing list for any future articles.
Or if you have any questions about becoming a member, please use the email address above.
If you like what you see, or want to see more of my work, then please sign up for the 4 week trial.
This article is just a small portion of the markets I follow.
I cover many markets, from FX to US equities, right the way through to commodities.
If I have the data I am more than willing to offer requests to members.
Currently new members can sign up for a 4 week free trial to test drive the site, and see if my work can help in your trading and if it meets your requirements.
If you don't like what you see, then drop me an email within the 1st 4 weeks from when you join, and ask for a no questions refund.
You simply have nothing to lose.
By Jason Soni AKA Nouf
© 2015 Copyright Jason Soni AKA Nouf - All Rights Reserved
Disclaimer: The above is a matter of opinion provided for general information purposes only and is not intended as investment advice. Information and analysis above are derived from sources and utilising methods believed to be reliable, but we cannot accept responsibility for any losses you may incur as a result of this analysis. Individuals should consult with their personal financial advisors.
WavePatternTraders Archive |
© 2005-2022 http://www.MarketOracle.co.uk - The Market Oracle is a FREE Daily Financial Markets Analysis & Forecasting online publication.