


Crude Oil Price Technical Outlook
Commodities / Crude Oil Apr 15, 2015 - 10:43 AM GMTBy: Donald_W_Dony

 Following part 1 of the Technical outlook for oil on April 7, this report examines the effect of the secular Commodity cycle on stocks (S&P 500), the U.S dollar on the CRB and WTIC's price since 1980.
Chart 1 is the S&P 500 since 1960. It traces the different trading patterns of the U.S. index during a secular Commodity cycle (1965-1980), a Stock cycle (1980-2000) and through another Commodity cycle (2000-2013) and the beginning of a new Stock cycle (2013 to present).
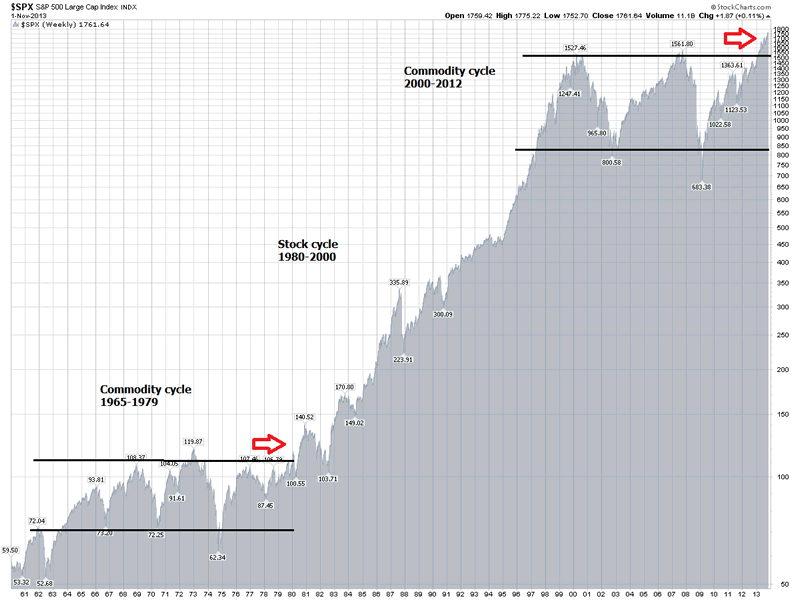
The pattern of the S&P 500, during commodity-dominated cycles (1965-1980 and 2000-2013), are similar. The U.S. index trades within a well-defined range with deep and prolonged corrections.
Most recently, the S&P 500 has broken out of the trading range in 2013 (similar to the breakout of the 1965-1980 Commodity cycle), signaling, in our opinion, the end of another secular Commodity cycle and the expected beginning of another Stock cycle.
In Chart 2, illustrates one of the main elements of a Stock cycle; a rising U.S. dollar.
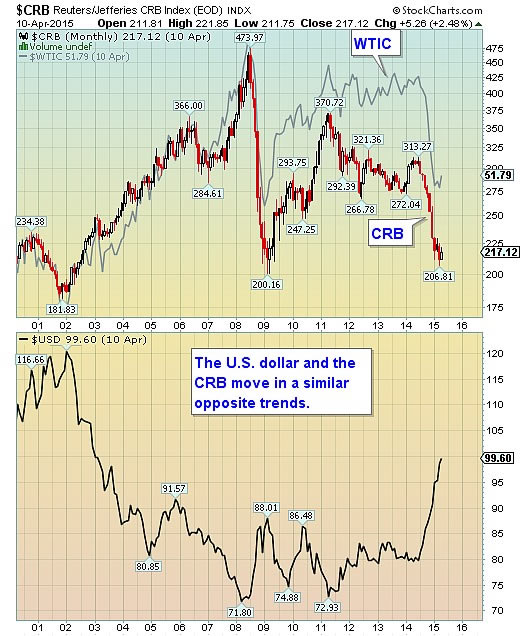
The US$ bottomed in 2008 and eventually broke out 2014 with strong market support.
The immediate effect on the CRB is downward pressure. The Commodity Research Bureau index fell 30% in 2014 whereas the US$ rose 25%.
Energy-related commodities (oil, natural gas and gasoline), which are the largest single component in the CRB, dropped a remarkable 50% in value in 2014.
Chart 3 is Light crude oil prices during the 1980-2000 Stock cycle, the 2000-2013 Commodity cycle and the start of the most recent Stock cycle (2013 to present).
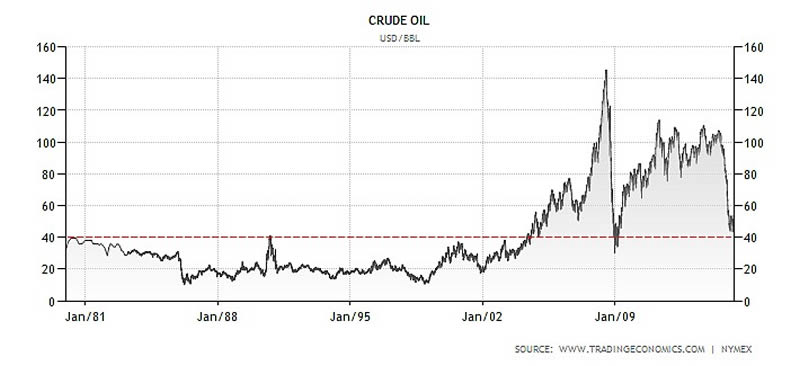
WTIC remained range-bound below $40 throughout the last Stock cycle (1980-2000) only to rebound above $40 as the Commodity cycle began to unfold.
However, with the end of the Commodity cycle in 2013 and the beginning of a new Stock cycle, oil prices fell to the $40 support mark in 2014.
Bottom line: WTIC prices are following the pattern of a completion of a Commodity cycle and the start of a new Stock (S&P 500) cycle. The rising U.S. dollar, new highs in the S&P 500 and the on-going shift of capital toward non-commodity sectors helps to reinforce our belief that a new secular Stock cycle has begun.
As in the last Stock cycle (1980-2000), we anticipate that WTIC prices will remain contained. However, unlike in the last Stock cycle where oil held within the $10-$40 range, we believe WTIC should be remain above the $40 support level but hold to the $40-$65 range.
By Donald W. Dony, FCSI, MFTA
www.technicalspeculator.com
COPYRIGHT © 2015 Donald W. Dony
Donald W. Dony, FCSI, MFTA has been in the investment profession for over 20 years, first as a stock broker in the mid 1980's and then as the principal of D. W. Dony and Associates Inc., a financial consulting firm to present. He is the editor and publisher of the Technical Speculator, a monthly international investment newsletter, which specializes in major world equity markets, currencies, bonds and interest rates as well as the precious metals markets.
Donald is also an instructor for the Canadian Securities Institute (CSI). He is often called upon to design technical analysis training programs and to provide teaching to industry professionals on technical analysis at many of Canada's leading brokerage firms. He is a respected specialist in the area of intermarket and cycle analysis and a frequent speaker at investment conferences.
Mr. Dony is a member of the Canadian Society of Technical Analysts (CSTA) and the International Federation of Technical Analysts (IFTA).
Donald W. Dony Archive |
© 2005-2022 http://www.MarketOracle.co.uk - The Market Oracle is a FREE Daily Financial Markets Analysis & Forecasting online publication.