


Hybrid Lindsay Stock Market Forecast for a Top Near April 15
Stock-Markets / Stock Markets 2015 Apr 14, 2015 - 04:07 PM GMTBy: Ed_Carlson

 With Friday’s breakout from the symmetrical triangle (formed during March and early April) equities should be off to the races and on their way to the triangle’s target of 2,175, right? While there is no reason to doubt the breakout or the target, “off to the races” may be too strong of term for now as there is a Hybrid Lindsay forecast for a high near April 15.
The Hybrid Lindsay model is my own combination of the work of George Lindsay together with traditional cycle analysis which enables the forecasting of short-term highs and lows that Lindsay never bothered to address. The Hybrid forecast for a low on March 6-9 was two days early as that low fell on March 11. The Hybrid forecast for a high on March 23 was dead-on and the Dow printed its most recent low on March 26 – two trading days prior to the Hybrid forecast for a low on March 30.
The period surrounding Apr 15 is the next likely high in the Dow. Below is an explanation of how that forecast was developed. It begins with Lindsay’s approach of finding confirming forecasts from both the basic and multiple cycles.
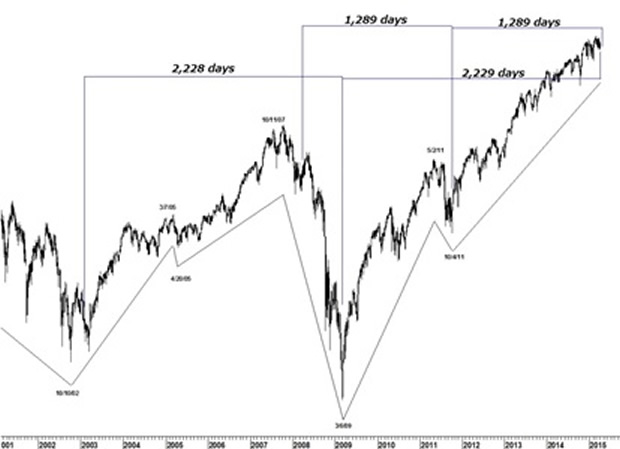
Basic Cycle
The high of a small flattened top on 3/24/08 counts 1,289 days to the low of the basic cycle on 10/4/11. 1,289 days later is 4/15/15.
Multiple Cycle
Point E on 1/29/03 of a descending middle section counts 2,228 days to the low of the multiple cycle on 3/6/09. 2,229 days later is Monday, 4/13/15.
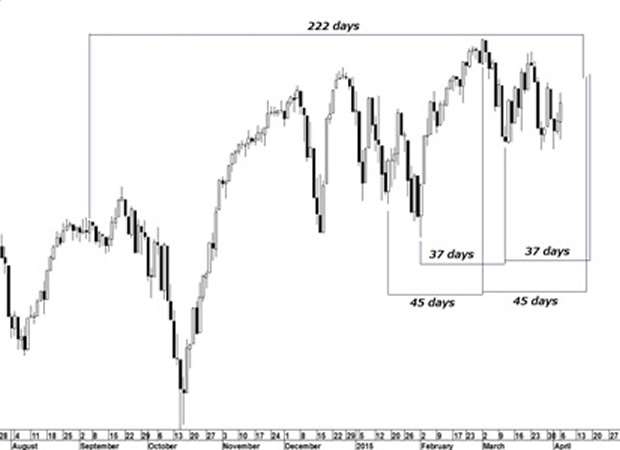
222 day interval
The 222 day interval (221-225 days) is important in Lindsay’s work. Lindsay discovered that this interval has appeared throughout the entire history of the Dow. Counting from the high on 9/5/14 to Apr 15 is 222 days.
Low-Low-High interval
The lows of 2/2/15 and 3/11/15 are 37 days apart. Counting forward another 37 day interval forecasts a high near Apr 17.
Low-High-High interval
The low on 1/16/15 counts 45 days to the bull market high on 3/2/15. Counting forward another 45 day interval forecasts a high near Apr 16.
Try a "sneak-peek" at Lindsay research (and more) at Seattle Technical Advisors.
Ed Carlson, author of George Lindsay and the Art of Technical Analysis, and his new book, George Lindsay's An Aid to Timing is an independent trader, consultant, and Chartered Market Technician (CMT) based in Seattle. Carlson manages the website Seattle Technical Advisors.com, where he publishes daily and weekly commentary. He spent twenty years as a stockbroker and holds an M.B.A. from Wichita State University.
© 2015 Copyright Ed Carlson - All Rights Reserved
Disclaimer: The above is a matter of opinion provided for general information purposes only and is not intended as investment advice. Information and analysis above are derived from sources and utilising methods believed to be reliable, but we cannot accept responsibility for any losses you may incur as a result of this analysis. Individuals should consult with their personal financial advisors.
© 2005-2022 http://www.MarketOracle.co.uk - The Market Oracle is a FREE Daily Financial Markets Analysis & Forecasting online publication.