New Credit Crunch Underway: Can Recession Be Far Behind?
Economics / Recession 2015 Apr 13, 2015 - 02:31 PM GMTBy: Mike_Shedlock
 Credit Crunch Underway
Last week, Alexander Giryavets of Dynamika Capital L.L.C. pinged me with an article he had written on Recessionary Level in Credit Conditions.
His article was based on data from the March Credit Managers' Index by the National Association of Credit Management. The report is pretty damning.
First, let's take a look at some NACM snips. Emphasis in italics is mine. Following the NACM snips and some NACM explanations, we will return to a chart from Giryavets.
From the March NACM Credit Managers Report:
Combined Sectors [Manufacturing and Service]
There is quite obviously some serious financial stress manifesting in the data and this does not bode well for the growth of the economy going forward. These readings are as low as they have been since the recession started and to see everything start to get back on track would take a substantial reversal at this stage. The data from the CMI is not the only place where this distress is showing up, but thus far, it may be the most profound.
The combined score is getting dangerously closer to the contraction zone and has not been this weak in many years (going back to 2010). It is sitting at 51.2 and that is down from the 53.2 noted last month.
The most drastic fall took place with the unfavorable factors that indicate the real distress in the credit market. It has tumbled from 50.5 to 48.5 and that is firmly in the contraction zone -- a place this index has not been since the days right after the recession formally ended. The signal this sends is that many companies are not nearly as healthy as it has been assumed and that there is considerably less resilience in the business sector than assumed.
The breakdown of the two index categories proves instructive. The category of sales slid to 57.9 and that is a far cry from the 65.7 that was notched back in October of last year. These numbers have been in the high 5 0s and 60s for the last year and now the slide is accelerating. The new credit applications category actually improved from 54.5 to 57.4, but when one combines this reading with the one for amount of credit extended, you get a n even more miserable story than one would assume. The latter reading went from 52.1 to a very troubling 46.1. There may be more applications for credit, but there is not all that much getting issued and that indicates that much of the new credit being requested is coming from companies that are not in a position to get that credit.
The real damage is showing up in the unfavorable categories. By far the most disturbing is the rejection of credit applications as this has fallen from an already weak 48.1 to 42.9. This is credit crunch territory -- unseen since the very start of the recession. Suddenly companies are having a very hard time getting credit. The accounts placed for collection reading slipped below 50 with a fall from 50.8 to 49.8 and that suggests that many companies are beyond slow pay and are faltering badly. The disputes category improved very slightly from 48.8 to 49, but is still below 50. This indicates that more companies are in such distress they are not bothering to dispute; they are just trying to survive. The dollar amount beyond terms slipped even deeper into contraction with a reading of 45.5 after a previous reading of 48.4. The dollar amount of customer deductions slipped out of the 50s as i t went from 51.8 to 48.7. The only semi-bright spot was that filings for bankruptcies stayed almost the same -- going from 55.0 to 55.1. This is the one and only category in the unfavorable list that did not fall into contraction territory and that suggests that there are big, big problems as far as the financial security of these companies are concerned.
Manufacturing Sector
The damage this month is pretty widespread and the manufacturing sector took a hit as well as the service sector. The combined index slipped from 53.7 to 51.6 and that is getting uncomfortably close to the contraction zone. The index of favorable factors remains in acceptable territory with a reading of 55.6 after one of 57.9 la st month, but for the bulk of the last year these readings have been in the 60s and trending in a far more positive direction is the case right now. The index of unfavorable factors is where the damage really starts to manifest as the overall score slipped from 50.9 to 48.9 and that marks the first time the combined reading has been this low since 2010, although it must be pointed out that these readings have not been all that high for quite a while -- bouncing along in the low 50s for the past couple of years.
The new credit applications category stayed roughly the same as last month with a slight rise from 56.7 to 58.6, but as pointed out in the narrative above, this is not really good news as the amount of credit extended slipped badly from 49.4 to 45.1. The fact is that companies that are not all that creditworthy are trying to get credit and they are not getting much attention.
As stated earlier, the real concerns start to manifest with the unfavorable categories. The rejections of credit applications fell out of the 50s with a resounding thud -- going from 50.3 to 43.8. There is most definitely a credit crunch underway and it is now easy to determine what the prime factor is. There are many companies seeking credit that are too weak and there is obviously an abundance of caution showing up in those that issue that credit.
The big news is access to credit. It is suddenly very hard to get and this looks like the situation that existed at the start of the recession in 2008 [2007 actually]. The overall economy didn't look all that bad in late 2008, except that there was a dearth of credit and that soon led to business failures and struggles.
Service Sector
As was the case last month, the majority of the damage was seen in the service sector and this month it is going to be hard to blame it all on the weather or some other seasonal factor. The combined index is teetering right on the edge of contraction as it has slipped from 52.6 to 50.9. The index of favorable factors fell from 56.4 to 55.2 and just as with manufacturing, the big issue was access to credit. The sales category was not affected all that much from last month, but is down from much of the last year. It has fallen from 57.9 to 56.9. Again we see a hike in the new credit applications category as it moved from 52.1 to 56.2 and again this is far from good news given that amount of credit extended slipped from 54.8 to 47.2. The pattern is the same whether one is discussing the manufacturing or service side -- too many seeking credit that are not going to get what they are seeking -- either because there are doubts as to their credit status or because those issuing credit are in a very cautious mood.
The overall unfavorable reading has been above 50 for several years and in some months, the reading was nearly mid-50s. That is no longer the case as the numbers slipped from 50.1 to 48.0. The details illustrate the problems just as they do for manufacturing. The rejections of credit applications is as miserable as it has been since the depths of the recession -- going from 45.9 to 42.0. These are very bad readings and it will take a good long while to climb out of this mess. The accounts placed for collection category is weak as well -- going from 49.9 to 48.1, but at least the fall wasn't as dramatic as with some of the other readings. The disputes category fell out of the 50s with a reading of 49.4 following last month's reading of 50.4. The dollar amount beyond terms improved a little but still remained in the 40s -- going from 44.7 to 45.1. The dollar amount of customer deductions went from 54.8 to 48.7 and that was a sharp drop. The filings for bankruptcies went from 54.9 to 55.0 and that was one of the very few positive readings this month.
March 2015 versus March 2014
The year-over-year trend remains miserable and seems to be getting worse and thus far nearly all the blame can be laid at the feet of credit access. There is just not a lot of confidence in those that are doing the credit offerings these days.
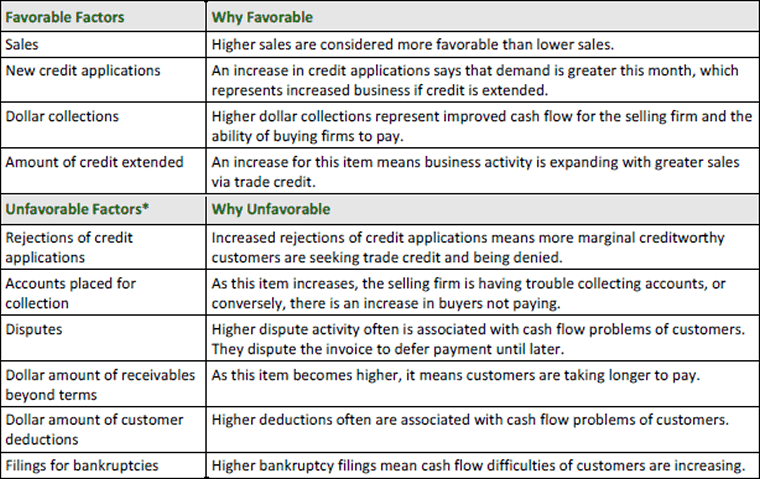
NACM Favorable and Unfavorable Factors

This is somewhat counterintuitive, but negative unfavorable scores are not a good thing. "When survey respondents report increases in unfavorable factors, the index numbers drop, reflecting worsening conditions."
Recessionary Credit Conditions
Inquiring minds may wish to read Recessionary Level in Credit Conditions by Alexander Giryavets.
The charts in Giryavets' article are in his words "shifted and rescaled" so one can see how much of subcomponent movement can be explained by index movement.
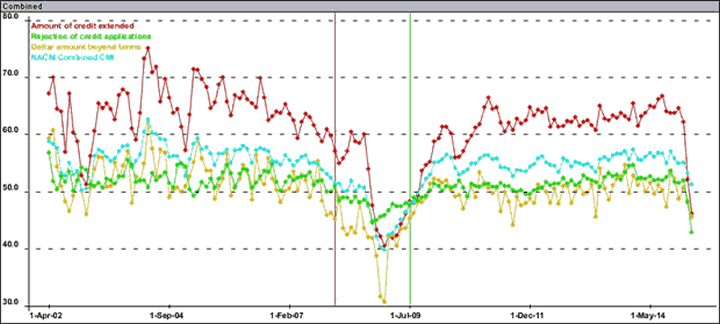
Some may find those charts hard to follow, so I asked Giryavets for a simple chart of the overall index, credit extended, rejection of credit, and dollar amount beyond terms. He graciously created that chart for us, shown below.
Combined Index, Amount of Credit Extended, Credit Rejected, Dollar Amount Beyond Terms

Start of recession is denoted by vertical red line, end of recession by vertical green line.
Can Recession Be Far Behind?
NACM data only goes back to 2002. Also data prior to 2006 is not seasonally adjusted, while data from 2006 and later is seasonally adjusted.
In the entire series since 2002, the only other time we have seen deep plunges in amount of credit extended and rejection of credit applications was deep in the middle of the last recession. Those are apples to apples comparisons, both seasonally adjusted.
Although comparisons between seasonally adjusted numbers and unseasonably adjusted numbers are technically invalid, if anything that would have led to more volatility between comparisons, not less.
This is still more supporting evidence that a recession is on the way. Heck, we may even be in the start of one right now, just as everyone is expecting rate hikes.
By Mike "Mish" Shedlock
http://globaleconomicanalysis.blogspot.com
Click Here To Scroll Thru My Recent Post List
Mike Shedlock / Mish is a registered investment advisor representative for SitkaPacific Capital Management . Sitka Pacific is an asset management firm whose goal is strong performance and low volatility, regardless of market direction.
Visit Sitka Pacific's Account Management Page to learn more about wealth management and capital preservation strategies of Sitka Pacific.
I do weekly podcasts every Thursday on HoweStreet and a brief 7 minute segment on Saturday on CKNW AM 980 in Vancouver.
When not writing about stocks or the economy I spends a great deal of time on photography and in the garden. I have over 80 magazine and book cover credits. Some of my Wisconsin and gardening images can be seen at MichaelShedlock.com .
© 2015 Mike Shedlock, All Rights Reserved.
Disclaimer: The above is a matter of opinion provided for general information purposes only and is not intended as investment advice. Information and analysis above are derived from sources and utilising methods believed to be reliable, but we cannot accept responsibility for any losses you may incur as a result of this analysis. Individuals should consult with their personal financial advisors.
Mike Shedlock Archive |
© 2005-2022 http://www.MarketOracle.co.uk - The Market Oracle is a FREE Daily Financial Markets Analysis & Forecasting online publication.


