


Stocks Bull Market Continues
Stock-Markets / Stock Markets 2015 Apr 11, 2015 - 12:52 PM GMTBy: Tony_Caldaro

 The market started the week gapping down from SPX 2067, Friday’s close, to 2057. That opening gap down was the low for the week. The market then rallied to SPX 2090 on Tuesday, pulled back to 2073 on Wednesday, then hit 2103 on Friday. Despite all the choppiness the market had a good week. For the week the SPX/DOW gained 1.70%, the NDX/NAZ gained 2.35%, and the DJ World gained 1.90%. Economic reports for the week were sparse but again tilted to the upside. On the uptick: consumer credit, wholesale inventories, export prices, the WLEI, and the MMIS. On the downtick: ISM services, import prices, plus weekly jobless claims rose. Next week’s reports are highlighted by Industrial production, Retail sales, the CPI/PPI and the FED’s Beige book.
LONG TERM: bull market
The 2009 Cycle wave [1] bull market, now six years old, is within 1% of extending in time and price. We continue to label this bull market as a five Primary wave event. Primary waves I and II completed in 2011, and Primary wave III has been underway since the October 2011 low. Primary I unfolded in five Major waves with a subdividing Major wave 1, and simple Major waves 3 and 5. Primary III is also unfolding in five Major waves, however, its Major wave 1 was simple, Major wave 3 subdivided, and we are expecting Major wave 5 to subdivide as well.
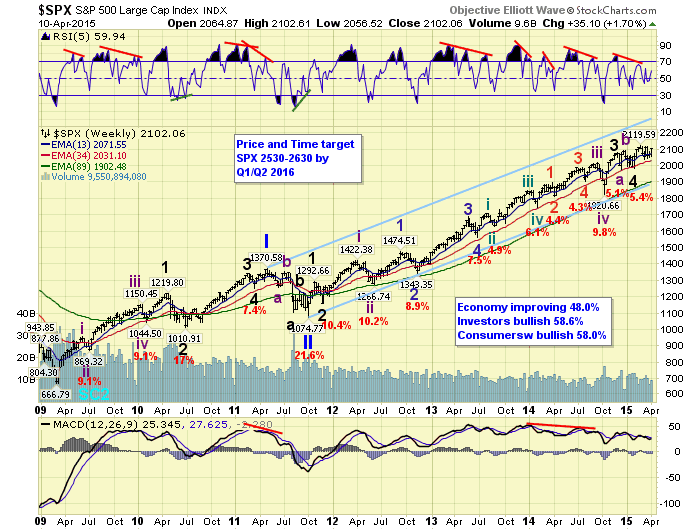
During Primary III Major waves 1 and 2 completed in late 2011. Major wave 3 subdivided for three years, completing in late 2014, and Major wave 4 completed in early 2015. After the Major wave 4 SPX 1981 low the market entered an uptrend. This uptrend, which reached a high in late-February at SPX 2120, is still underway, despite the sideways choppy activity since then. Our target for Primary III remains SPX 2530-2630 by Q1/Q2 2016.
MEDIUM TERM: uptrend still underway
After completing Major wave 4 with an irregular failed flat in early-February, the market rallied in five waves to SPX 2120. Since then, as noted above, the market activity has been a sideways/choppy event. Our most probable count(s) suggest either Minor wave 1 of Intermediate wave i completed at that high. And the current/recent pullback has been Minor wave 2, as long as the uptrend continues. Or, Intermediate wave i completed at SPX 2102, if a downtrend is confirmed. Under both scenarios were have been expecting support at SPX 2035/36 and worse case the 2019 pivot range. Thus far the uptrend has continued. We have three low probability scenarios that were covered initially two weeks ago, and generally last weekend as well.
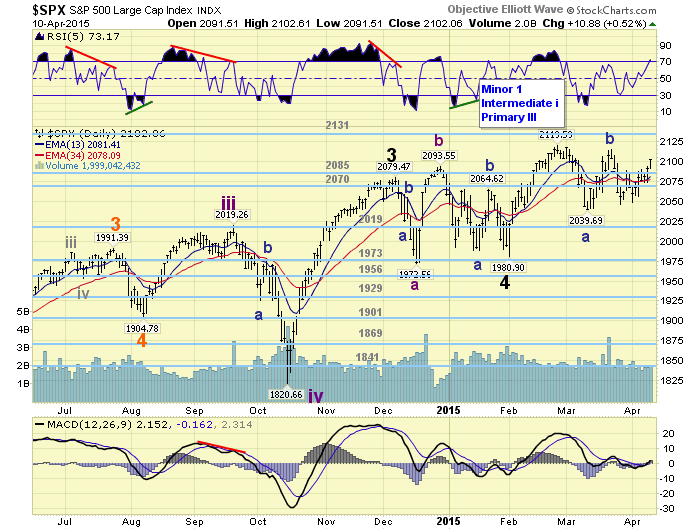
After the uptrend hit SPX 2120 the market declined to 2040 over the next two weeks. Then it rallied to SPX 2115 within a week or so. Before declining to SPX 2046, and then 2048, before the recent rally to 2103 on Friday. While the recent rally has looked quite choppy it continues to work its way toward the all time high. We have been expecting a retest of the recent 2040’s low before the uptrend resumed. We still prefer that scenario, but it will be abandoned if the market makes new highs. With this potential in mind we took a closer look at the larger waves within this rally. Medium term support is at the 2085 and 2070 pivots, with resistance at the 2131 and 2198 pivots.
SHORT TERM
Since Major wave 4 ended on a failed flat: wave A SPX 1974, and wave C SPX 1981. We could consider a failed flat scenario for Minor wave 2: wave A SPX 2040 and wave C SPX 2048. Under this scenario we would have expected Minor wave 3 to kick off strongly to the upside. That has not occurred at all. The rally from SPX 2048 to Friday’s SPX 2103 had an abundant amount of reversals: 15 small waves. Looking at the larger waves, however, we can count only seven waves up on two short term timeframes: 2072-2057-2090-2073-2088-2074-2103.
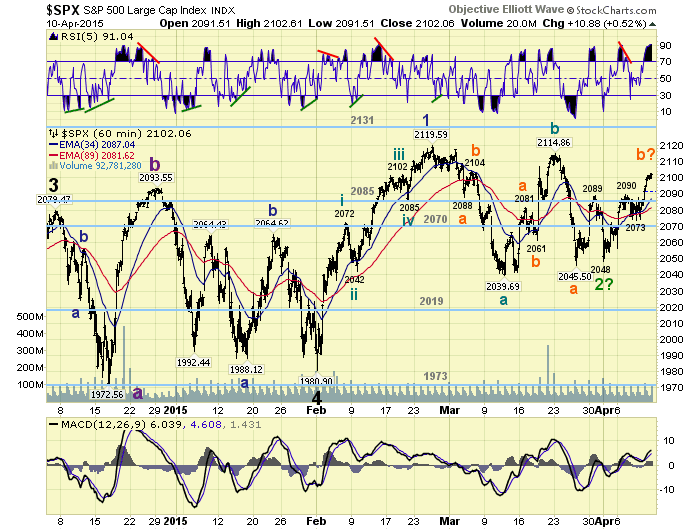
Using these larger waves it does not look nearly as choppy. This pattern could suggest a Minute wave i, of Minor 3, has been underway. If this is the correct count the market should hold the SPX 2070 pivot range on any pullback before launching Minute iii of Minor 3. Failure to hold the OEW 2070 pivot range would suggest an ongoing correction/pullback with support between the 2019 pivot and the SPX 2040’s. Short term support is at the 2085 and 2070 pivots, with resistance at SPX 2115 and SPX 2120. Short term momentum ended the week extremely overbought.
FOREIGN MARKETS
Asian markets were all higher on the week for a net gain of 2.6%.
European markets were also all higher, and also gained 2.6%.
The Commodity equity group were all higher and gained 4.1%.
The DJ World index is uptrending, made a new all time high, and gained 1.9%.
COMMODITIES
Bonds continue to uptrend but lost 0.3% on the week.
Crude is in an uptrend and gained 4.2% this week.
Gold is in an uptrend and gained 0.2% this week.
The USD continues to defy gravity, has been uptrending since last May, and gained 2.0% on the week.
NEXT WEEK
Tuesday: Retail sales, the PPI and Business inventories. Wednesday: the NY FED, Industrial production, the NAHB, and the FED’s Beige book. Thursday: weekly Jobless claims, Housing starts. Building permits, and the Philly FED. Friday: the CPI, Consumer sentiment, Leading indicators, and Options expiration. Best to your weekend and week!
CHARTS: http://stockcharts.com/public/1269446/tenpp
http://caldaroew.spaces.live.com
After about 40 years of investing in the markets one learns that the markets are constantly changing, not only in price, but in what drives the markets. In the 1960s, the Nifty Fifty were the leaders of the stock market. In the 1970s, stock selection using Technical Analysis was important, as the market stayed with a trading range for the entire decade. In the 1980s, the market finally broke out of it doldrums, as the DOW broke through 1100 in 1982, and launched the greatest bull market on record.
Sharing is an important aspect of a life. Over 100 people have joined our group, from all walks of life, covering twenty three countries across the globe. It's been the most fun I have ever had in the market. Sharing uncommon knowledge, with investors. In hope of aiding them in finding their financial independence.
Copyright © 2015 Tony Caldaro - All Rights Reserved Disclaimer: The above is a matter of opinion provided for general information purposes only and is not intended as investment advice. Information and analysis above are derived from sources and utilising methods believed to be reliable, but we cannot accept responsibility for any losses you may incur as a result of this analysis. Individuals should consult with their personal financial advisors.
Tony Caldaro Archive |
© 2005-2022 http://www.MarketOracle.co.uk - The Market Oracle is a FREE Daily Financial Markets Analysis & Forecasting online publication.