


Will Quantitative Easing Demolish Stock Market Indicators?
Stock-Markets / Stock Markets 2015 Apr 08, 2015 - 01:38 PM GMTBy: Harry_Dent

 In late 2008, we knew we had a problem.
For years we had used the Economic Cycle Research Institute (ECRI) for predicting recessions before they occurred. This leading indicator had a much better track record than the more traditional ones.
But after QE started in November of that year, this indicator started to falter. The institute had predicted a recession in early 2011, but as QE dragged on, it just didn’t happen.
ECRI wasn’t the only one. The Consumer Metrics Institute’s (CMI) Daily Growth Index also started to fail from early 2010 forward.
I remember introducing Rick Davis, CMI’s founder, at one of our conferences back in 2008. I told our subscribers “we have a secret weapon here,” as few people knew about this indicator.
Now, like ECRI, the Daily Growth Index is merely a coincident indicator, not a leading one.
It’s not that these indicators are inaccurate. They were once about as spot on as you can get.
It’s that we’ve poisoned the economy with something-for-nothing, QE-driven policies, essentially draining these indicators of all the power they once had.
When major leading indicators start to warn that the economy is beginning to weaken, what do central banks do? Just up the ante and inject enough money to offset the downturn.
Magic!
Here’s a chart that shows just how well the ECRI Weekly Leading Index was at forecasting recessions well ahead of time… until QE got in the way.
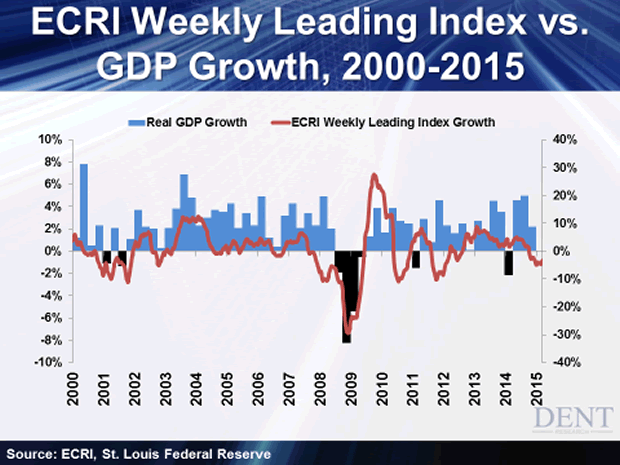
This shows you that we have an artificial economy. Money injections keep banks and bad loans from failing as much as they otherwise would. Zero interest rates — both short- and long-term, adjusted for inflation — encourage greater speculation and something-for-nothing profits.
That helps financial institutions and higher net-worth households. The everyday person? Not so much.
A normal recovery would create a reset that rebalances the economy and allows for growth. Consumers would start spending again. Businesses would start reinvesting in production capacity and jobs. Those jobs would reinforce the economic rebound and spending! That’s what these leading indicators measure.
Simply printing money can’t create long-term growth and prosperity. Like any drug, it only makes the system weaker.
When financial institutions and the 1% can make money with little risk on speculation, why would they invest in productive capacity?
As the Grateful Dead said in a famous song: “Driving that train, high on cocaine, Casey Jones, you better watch your speed.”
We’re heading for that train wreck — period!
Right now, I’m keeping a close eye on some of the classic leading indicators of a stock crash — the ones that measure when stocks are overvalued and a major correction or crash is due.
Sure, they could end up like ECRI, Consumer Metrics, and other economic indicators. They could fail to pass the QE test, too. But they’ve got numbers on their side…
Last month in The Leading Edge, I looked at a wide variety of overvaluation indicators, from margin debt (or speculation) to P/E ratios. 10 out of 12 are in extreme overvaluation territory. The two that aren’t both show signs of rapid aging… meaning this bull’s days are numbered!
Right now, the “smart money” doesn’t fear a major correction because the Fed “has their back.” The fact that they haven’t exited is why these two indicators are still flashing bullish.
They think this train will keep on truckin’. So why would they exit the stock market? Why would investors get more selective and give up the higher gains in smaller cap stocks, or the higher yields in junk bonds? To them, those are the places to be.
That’s a decision they’re going to live to regret.
I continue to advise you to get out of stocks and risk assets in passive retirement accounts. If you’re in a proven trading system that can smoothly rides the waves of a crash or other volatile period like Adam’s Max Profit Alert, then you can adapt and change with the winds.
Harry
Follow me on Twitter @HarryDentjr
Harry studied economics in college in the ’70s, but found it vague and inconclusive. He became so disillusioned by the state of the profession that he turned his back on it. Instead, he threw himself into the burgeoning New Science of Finance, which married economic research and market research and encompassed identifying and studying demographic trends, business cycles, consumers’ purchasing power and many, many other trends that empowered him to forecast economic and market changes.
Copyright © 2015 Harry Dent- All Rights Reserved Disclaimer: The above is a matter of opinion provided for general information purposes only and is not intended as investment advice. Information and analysis above are derived from sources and utilising methods believed to be reliable, but we cannot accept responsibility for any losses you may incur as a result of this analysis. Individuals should consult with their personal financial advisors.
© 2005-2022 http://www.MarketOracle.co.uk - The Market Oracle is a FREE Daily Financial Markets Analysis & Forecasting online publication.