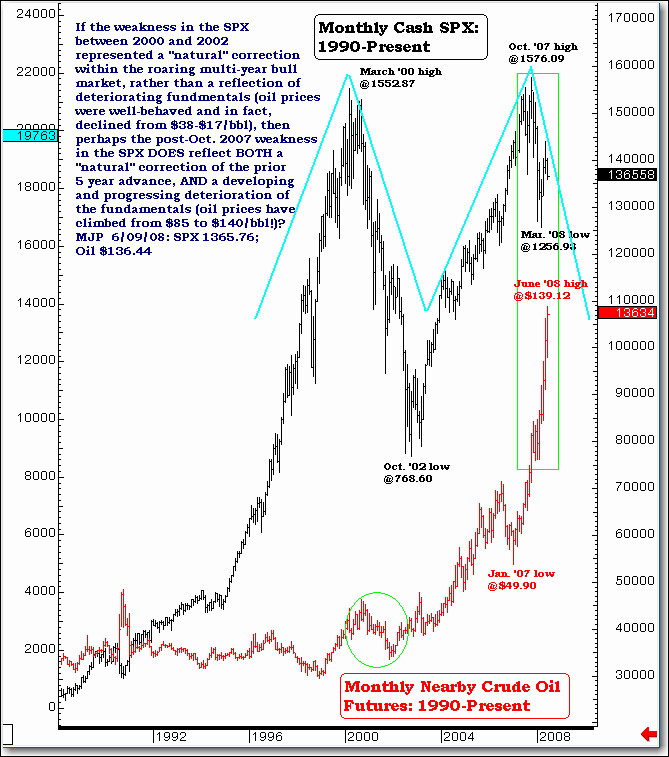
Crude Oil Comparison Illustrates Major Stock Market Weakness
Stock-Markets / US Stock Markets Jun 09, 2008 - 04:47 PM GMTBy: Mike_Paulenoff
 Our big picture view of the S&P 500 compared (or contrasted) to the price action of crude oil concludes that we need to get long the UltraShort S&P 500 ProShares ETF (AMEX: SDS), or short the SPY, at some point in the hours directly ahead.
If the weakness in the S&P 500 between 2000 and 2002 represented a "natural" correction within the roaring multi-year bull market, rather than a reflection of deteriorating fundamentals (oil prices were well-behaved and in fact declined from $38 to $17bbl), then perhaps the post-October 2007 weakness in the SPX does reflect both a "natural" correction of the prior 5-year advance and a developing and progressing deterioration of the fundamentals (oil prices have climbed from $85 to $140/bbl).

Sign up for a free 15-day trial to Mike's ETF Trading Diary today.
By Mike Paulenoff
Mike Paulenoff is author of the MPTrader.com (www.mptrader.com) , a real-time diary of Mike Paulenoff's trading ideas and technical chart analysis of Exchange Traded Funds (ETFs) that track equity indices, metals, energy commodities, currencies, Treasuries, and other markets. It is for traders with a 3-30 day time horizon, who use the service for guidance on both specific trades as well as general market direction
© 2002-2007 MPTrader.com, an AdviceTrade publication. All rights reserved. Any publication, distribution, retransmission or reproduction of information or data contained on this Web site without written consent from MPTrader is prohibited. See our disclaimer.
Mike Paulenoff Archive |
© 2005-2022 http://www.MarketOracle.co.uk - The Market Oracle is a FREE Daily Financial Markets Analysis & Forecasting online publication.


