


Stock Market Inflection Point
Stock-Markets / Stock Markets 2015 Mar 28, 2015 - 08:50 PM GMTBy: Tony_Caldaro

 The market started the week at SPX 2108. After an opening rally on Monday, the market hit SPX 2115 before 10am. Then after the first half hour of trading the market was essentially down for the rest of the week. For the week the SPX/DOW lost 2.25%, the NDX/NAZ lost 2.75%, and the DJ World index lost 1.8%. On the economic front reports came in nearly all to the upside, for the first time in weeks/months. On the uptick: existing/new home sales, the CPI, FHFA housing prices, consumer sentiment, the WLEI and weekly jobless claims improved. On the downtick: durable goods orders. Q4 GDP came in unchanged at +2.2%, and registered 2.4% growth for 2014, compared to growth of 2.2% in 2013 and 2.3% in 2012. Next week’s busy economic calendar will be highlighted by Personal income/spending, the PCE and non-farm Payrolls.
LONG TERM: bull market
We continue to label this six year bull market as Cycle wave [1] of Super cycle wave 3 from the GSC low in 1932. As a refresher. A GSC bull market lasts over 200 years, consisting of five Super cycle waves: three rising for about 75 years each, with two intervening declining waves that correct the market over 50%. Super cycle 1 of this GSC ended in 2007, and Super cycle 2 ended with the DOW 54% decline in 2009. Rising Super cycle waves consist of five Cycle waves. In example, Super cycle wave 1 consisted of Cycle wave 1: 1932-1937, Cycle wave 2: 1937-1942, Cycle wave 3: 1942-1973, Cycle wave 4: 1973-1974, and Cycle wave 5: 1974-2007.
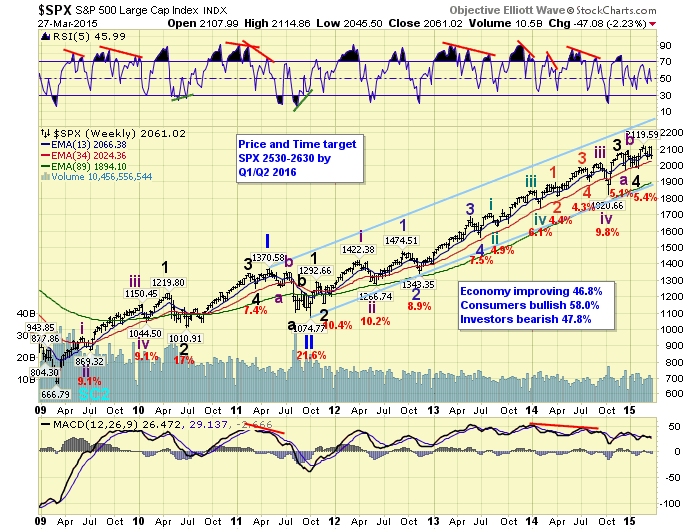
Rising Cycle waves unfold in five Primary waves. Our current Cycle wave [1] completed Primary waves I and II in 2011, and Primary wave III has been underway since that low. The rising Primary waves unfold in five Major waves. During Primary III: Major waves 1 and 2 completed in late 2011, Major waves 3 and 4 completed in late 2014 to early 2015, and Major wave 5 is currently underway. When Major wave 5 concludes it will end Primary III, and then the market should experience its largest correction since 2011 for Primary IV. After that concludes Primary V should then take the market to all time new highs to complete Cycle wave [1]. Thus far, we are expecting Primary waves III and IV to occur next year, in 2016, and Primary V to top in 2017. Our target range for Primary III is posted on the SPX weekly chart above.
MEDIUM TERM: downtrend probability increasing
There is a saying in technical circles that goes something like this; “Put 10 EW technicians in a room and they will arrive at 10 different counts.” For the most part this is likely true, since most EW technicians do not know OEW: how to quantify waves. What is also true is that at certain junctures, during bull/bear markets, even the OEW group can arrive at several different counts. Especially when markets goes sideways for an extended period of time. This market has been in a four month trading range, SPX 1970 – 2120, since November.
Since our goal is to remain objective in any market environment, we offer several counts, with our comments, so that you may pick and choose which one(s) best fit what you are seeing the market. We offer five counts in total, since these are the ones floating around the blogosphere. But will use just two charts to illustrate and discuss them, since many of the previous waves are as already labeled.
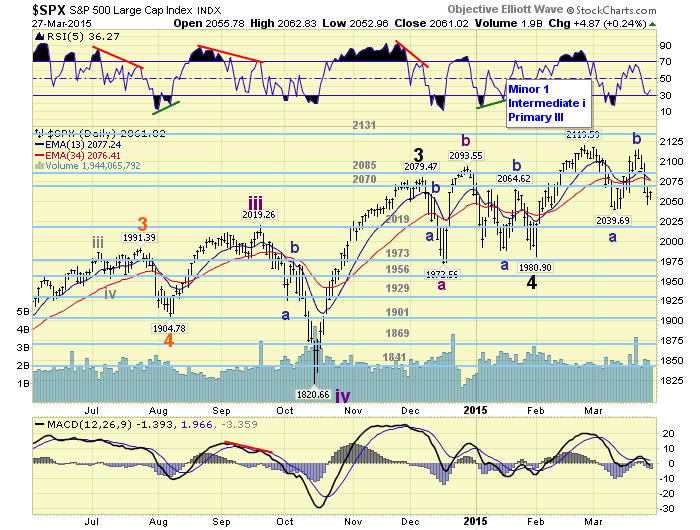
At the recent SPX 2120 there are three possible wave labels: Minor 1, Intermediate I and Primary III. The reason for this is that from the early February Major 4 low the uptrend to new highs could be/have been either part of a subdividing Intermediate wave i, all of Intermediate wave i, or all of Major wave 5. While we have calculated that Major wave 5 will likely subdivide and extend into the 2016 targets posted on the weekly chart. There are no guarantees, after this bull market has already tripled in value since 2009. For now, we continue to give the count posted on the SPX daily/hourly charts the highest probability: Minor wave 1, of Intermediate wave 1, of Major wave 5 completed at SPX 2120. Unless one, or both, of the following parameters are triggered by the market. First, if the current decline confirms a downtrend we will update the SPX 2120 high to an Intermediate wave i label. Second, if the then downtrend continues and breaks through the OEW 1973 pivot range we will update the SPX 2120 high to a Primary III label.
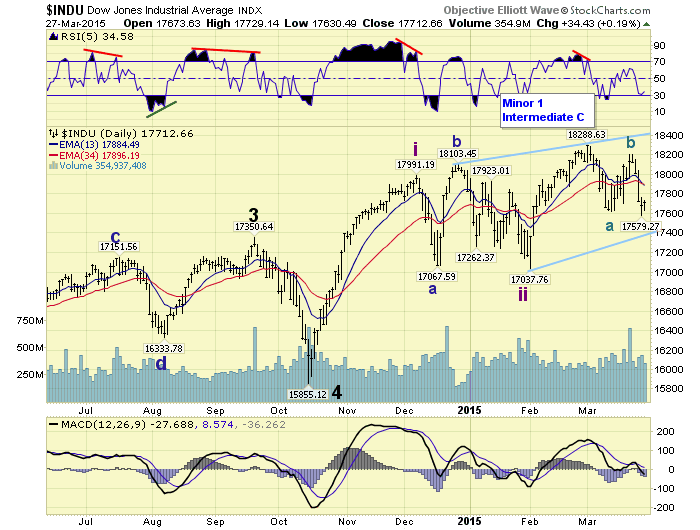
The DOW daily chart displays a slightly different count with a Major wave 4 low in October, rather than February. Some seem to prefer this scenario due to the depth of the October decline. For now, we continue to give this count an overall lesser probability than the SPX count. But are tracking it with Intermediate waves i and ii already completed, and Minor wave 1 of Intermediate wave iii completed at the recent 18,289 high. An alternate to this count would suggest an ongoing diagonal triangle Major wave 5 underway, as noted by the blue lines. This alternate would suggest an Int. A high at 18,103, an Int. B low at 17,038, and an Int. wave C high at 18,289. Int. wave D would be underway now, to be followed by an Int. wave E, at/near new highs, to complete the Major wave 5 diagonal. The two parameters here are: (1) the DOW needs to confirm a downtrend to increase the probability of the diagonal pattern, and (2) the then downtrend needs to remain above 17,200 to avoid turning the rising wedge of a diagonal into a more bullish rising channel.
Since we are dealing with probabilities for future market activity, based upon past quantified wave patterns, technical indicators, and fundamental economic indicators. We give these five patterns these probabilities: SPX Minor 2 underway 40%, SPX Intermediate ii underway 30%, the three other patterns 10% each. Medium term support is at the 2019 and 1973 pivots, with resistance at the 2070 and 2085 pivots.
SHORT TERM
We had been tracking the rally from the mid-March SPX 2040 low as the beginning of Minor wave 3. We had a i-ii, 1-2-3 labeled on the hourly chart: 2066-2041-2081-2061-2115. After Monday’s early high at SPX 2115 it started to pullback. By early Wednesday the market had already had its largest pullback since the rally began. Then when the SPX dropped below 2081 we knew the entire rally was corrective. As a result we updated the hourly chart with a Minute A at SPX 2040, a Minute B at SPX 2115, and a Minute C underway.
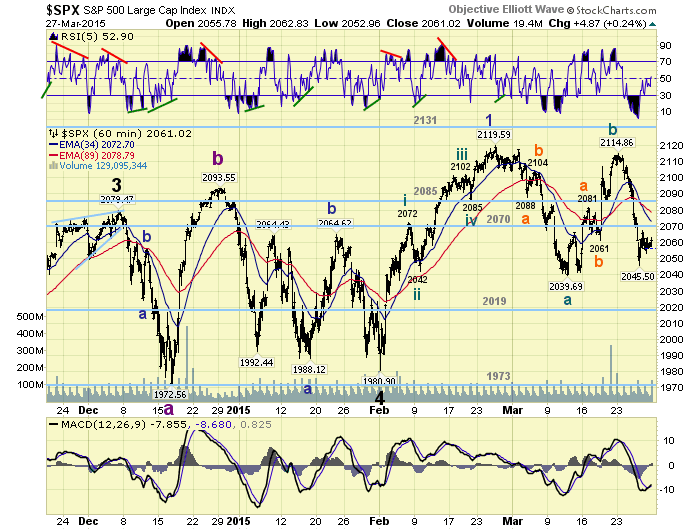
The market continued to decline on Thursday hitting SPX 2046. There were five small degree waves during the decline: 2099-2108-2049-2059-2046. Then the market rallied to SPX 2067, in what looks like a potential ‘b’ wave. The market then declined to SPX 2053, and rallied to 2063 on Friday. Thus far these last waves look like the beginning of a ‘c’ wave down. Should the market continue lower a complex Minor 2 flat could form at SPX 2040, or ‘c’ will = ‘a’ at SPX 2035. Anything lower, i.e. the 2019 pivot, and it will look like a complex zigzag. Until the market starts to impulse higher we have to think the short term trend is down. Short term support is at SPX 2035/2040 and the 2019 pivot, with resistance at the 2070 and 2085 pivots. Short term momentum ended the week around neutral.
FOREIGN MARKETS
Asian markets were mixed on the week for a net loss of 0.5%.
European markets were mostly lower on the week for a net loss of 0.8%.
The Commodity equity group were all lower for a loss of 1.7%.
The DJ World index is still in an uptrend but lost 1.7% on the week.
COMMODITIES
Bonds appear to be uptrending and gained 0.2% on the week.
Crude appears to be uptrending and gained 5.2% on the week.
Gold also appears to be uptrending and gained 1.5% on the week.
The USD appears to be downtrending and lost 0.7% on the week.
NEXT WEEK
Monday: Personal income/spending and PCE prices at 8:30, then Pending home sales at 10am, and a speech from FED vice chair Fischer at 7:15 pm. Tuesday: Case-Shiller, the Chicago PMI and Consumer confidence. Wednesday: the ADP index, ISM manufacturing, Construction spending, and Auto sales. Thursday: a speech from FED chair Yellen at 8:40, weekly Jobless claims, the Trade deficit, Factory orders, then a speech from FED governor Brainard at 3:45pm. Friday: Payrolls (est. +254k), and the Unemployment rate (est. 5.5%). Best to your weekend and week!
CHARTS: http://stockcharts.com/public/1269446/tenpp
http://caldaroew.spaces.live.com
After about 40 years of investing in the markets one learns that the markets are constantly changing, not only in price, but in what drives the markets. In the 1960s, the Nifty Fifty were the leaders of the stock market. In the 1970s, stock selection using Technical Analysis was important, as the market stayed with a trading range for the entire decade. In the 1980s, the market finally broke out of it doldrums, as the DOW broke through 1100 in 1982, and launched the greatest bull market on record.
Sharing is an important aspect of a life. Over 100 people have joined our group, from all walks of life, covering twenty three countries across the globe. It's been the most fun I have ever had in the market. Sharing uncommon knowledge, with investors. In hope of aiding them in finding their financial independence.
Copyright © 2015 Tony Caldaro - All Rights Reserved Disclaimer: The above is a matter of opinion provided for general information purposes only and is not intended as investment advice. Information and analysis above are derived from sources and utilising methods believed to be reliable, but we cannot accept responsibility for any losses you may incur as a result of this analysis. Individuals should consult with their personal financial advisors.
Tony Caldaro Archive |
© 2005-2022 http://www.MarketOracle.co.uk - The Market Oracle is a FREE Daily Financial Markets Analysis & Forecasting online publication.