Did the Stock Market Really Fail 3 Times?
Stock-Markets / Stock Markets 2015 Mar 28, 2015 - 05:17 PM GMTBy: Marty_Chenard
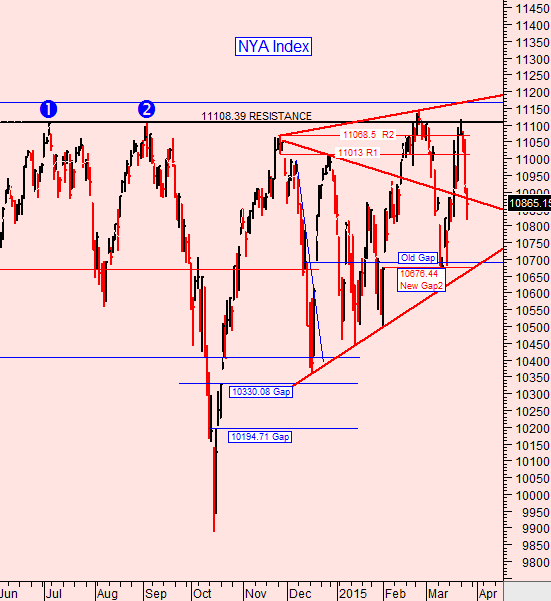
Three times it tried ... Yes, the NYA Index tried to move and stay above its 11108.39 resistance, but it failed to do so three times.
For normal investors, this is high danger sign that suggests moving cautiously is prudent.
Take a look at the current NYA Index chart below and you will see that yesterday's tick was back inside its first triangular pattern and still below the 11108.39 level.
This depicts a struggling market that is pausing and considering its next direction.

By Marty Chenard
http://www.stocktiming.com/
Please Note: We do not issue Buy or Sell timing recommendations on these Free daily update pages . I hope you understand, that in fairness, our Buy/Sell recommendations and advanced market Models are only available to our paid subscribers on a password required basis. Membership information
Marty Chenard is the Author and Teacher of two Seminar Courses on "Advanced Technical Analysis Investing", Mr. Chenard has been investing for over 30 years. In 2001 when the NASDAQ dropped 24.5%, his personal investment performance for the year was a gain of 57.428%. He is an Advanced Stock Market Technical Analyst that has developed his own proprietary analytical tools. As a result, he was out of the market two weeks before the 1987 Crash in the most recent Bear Market he faxed his Members in March 2000 telling them all to SELL. He is an advanced technical analyst and not an investment advisor, nor a securities broker.
Marty Chenard Archive |
© 2005-2022 http://www.MarketOracle.co.uk - The Market Oracle is a FREE Daily Financial Markets Analysis & Forecasting online publication.


