


How Stock Investors Should Play the 2016 Presidential Race
Stock-Markets / Stock Markets 2015 Mar 26, 2015 - 07:59 PM GMTBy: Investment_U

 Matthew Carr writes: There’s still a lot of anxiety bubbling in the markets. We started this week with three down days. As I write this, on Wednesday afternoon, the Dow is down 182 points.
It seems like everyone wants to bail. But there is a trend underway investors shouldn’t ignore... one you don’t want to bet against.
This past weekend, Sen. Ted Cruz kicked off the 2016 campaign season by officially throwing his hat into the ring. Which means we can now look forward to enduring two years of divisive campaign trail rhetoric.
For the stock market, however, the U.S. presidential election offers some interesting trends. It’s also a reason to hold off your fears of a market crash for at least another year.
Let’s start with some basics...
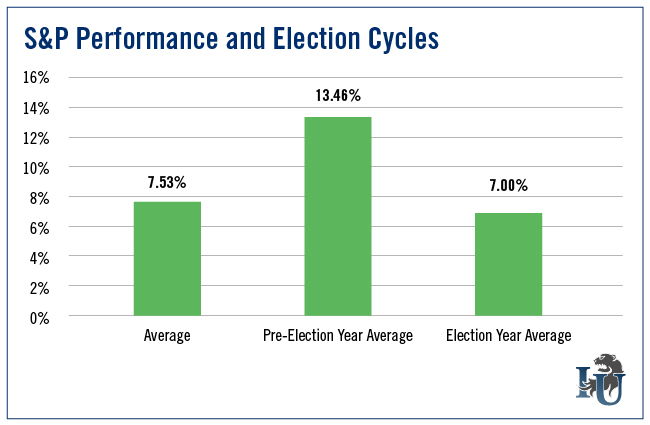
Since 1928, the average annual return of the S&P 500 is 7.53%.
That’s not bad. But what’s more important to remember is the S&P has ended the year flat or positive 60 times out of the last 87 years.
That’s a success rate of 68.97%.
This is why we invest in the stock market. There are more good years than bad (remember that during the next collapse). And the year ends in positive territory roughly seven out of 10 times.
But 2015 is a particularly important year for the markets. It’s a pre-election year. And these years have historically been some of the best for stocks.
Pre-Election Bull Runs
I mentioned above that the S&P has averaged a 7.53% gain per year since 1928. But during that span, the index’s average gain in a pre-election year is 13.46%.
That’s almost double the historic average.
Most importantly, the S&P in pre-election years ends in positive territory 90% of the time. There are only two losses for the index in a pre-election year, in 1931 and 1939.
So for those worried about a potential crash, it typically hasn’t happened in a pre-election year.
Now, the S&P was flat in 2011 and 1947 (both pre-election years). And it did return a mere 3.5% in 2007 and 2.03% in 1987. But it’s been more than 70 years since we’ve seen an actual loss during a pre-election year.
At the moment, the S&P is up about 1% - a far cry from that 13.46% pre-election year average. If you’re the type of person who likes to worry about the future, I can give you reason for concern...
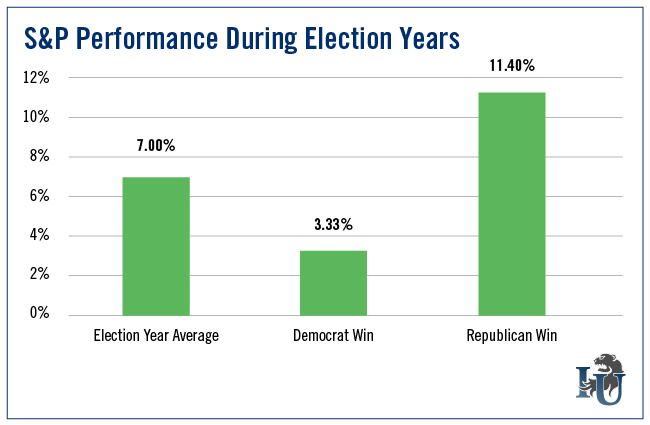
Next year is an election year. And during election years, the S&P averages a gain of 7%. That’s just slightly below its historic average of 7.53%, and well below the pre-election year average.
The good news is the chance for a positive return during election years is slightly higher than normal. In 22 years, the S&P posted 16 gains - a 72.73% success rate.
The worst election year returns for the S&P were 1932, 1940, 2000 and 2008. All double-digit losses.
If we break it down by party, the return changes fairly dramatically. In election years when the Democrats won, the S&P averaged a 3.33% return with the chances of a positive return on the index falling to 58.33%.
That’s considerably worse than the historic annual return of the S&P and less than half the average election year return.
In election years when the Republicans won, the S&P averaged a return of 11.4% with the chance of ending positive for the year increasing to 90%.
So, that’s better than the election year average and the historic average return of the S&P 500, and offers an extremely high chance of success.
But what about after the political campaign trail carnage is over?
Which party is the best for the market once at the helm of the White House?
Election Aftermath
There’s a general feeling that Republicans are best for the markets... That once the GOP takes control, investors should rejoice.
From election years when Republicans win, we could easily make that assumption. But post-election years are more difficult for the S&P...
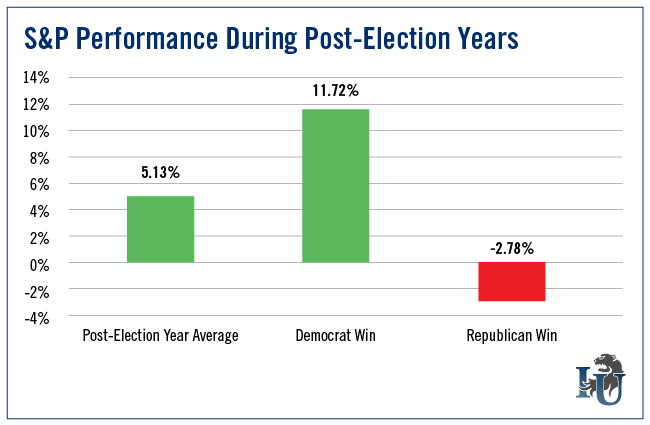
The average return of the index in years following an election falls to 5.13%. And the chance for a positive return declines to 54.55%.
In years following wins by the Democrats, the S&P averaged a return of 11.72%. Eight out of 11 times, the index ended positive - a success rate of 72.73%.
In stark contrast, the S&P averaged a -2.78% return in years following Republican victories. Only three of these years notched positive gains: 26.33% in 1985, 27.25% in 1989 and 3% in 2005.
The rest were losses: -11.91% in 1929, -6.62% in 1953, -14.31% in 1957, -11.63% in 1969, -17.37% in 1973, -9.73% in 1981 and -13.04% in 2001.
Early Returns
It’s still way early in the presidential cycle. After all, the first candidate just officially entered the contest. But, historically, the markets have looked forward to change and have performed well above average during these pre-election years.
It’s fine to be cautious. But as the old adage goes, “The trend is your friend... don’t fight it.”
Good investing,
Matthew
Have thoughts on this article? Leave a comment below.
P.S. Regardless of where Wall Street heads, politicians always seem to prosper, don’t they? It’s no secret that our civil servants in Washington are well compensated for all their “hard work.” But that’s not the full story. For decades, a closely guarded secret has discreetly handed folks like Barack Obama and Hillary Clinton fortunes of $5 million… $15 million… even as much as $4 billion. To find out how you can put it to work for you, click here.
Copyright © 1999 - 2015 by The Oxford Club, L.L.C All Rights Reserved. Protected by copyright laws of the United States and international treaties. Any reproduction, copying, or redistribution (electronic or otherwise, including on the world wide web), of content from this website, in whole or in part, is strictly prohibited without the express written permission of Investment U, Attn: Member Services , 105 West Monument Street, Baltimore, MD 21201 Email: CustomerService@InvestmentU.com
Disclaimer: Investment U Disclaimer: Nothing published by Investment U should be considered personalized investment advice. Although our employees may answer your general customer service questions, they are not licensed under securities laws to address your particular investment situation. No communication by our employees to you should be deemed as personalized investment advice. We expressly forbid our writers from having a financial interest in any security recommended to our readers. All of our employees and agents must wait 24 hours after on-line publication or 72 hours after the mailing of printed-only publication prior to following an initial recommendation. Any investments recommended by Investment U should be made only after consulting with your investment advisor and only after reviewing the prospectus or financial statements of the company.
Investment U Archive |
© 2005-2022 http://www.MarketOracle.co.uk - The Market Oracle is a FREE Daily Financial Markets Analysis & Forecasting online publication.