


One More Stock Market Rally and Then a Huge Drop Expected
Stock-Markets / Stock Markets 2015 Mar 26, 2015 - 07:07 AM GMTBy: Brad_Gudgeon

 Last article, I wrote about an important top coming. On March 25, the US Market dropped about 1.4% to 2061. The E-Waves are saying we are not through yet to the upside. I talked about the Bradley Siderograph and Financial Astrology, and used some humor (but I was quite serious...joking on the square so to speak). I also promised to show you some volume figures (this time around it will be the On Balance Volume on the SPY)
March 25th marked the 8 trading cycle low from the bottom on March 13, the Bradley Siderograph turn. The e-waves and cycles are saying that another even more powerful up move is coming and new highs on the S&P 500 are in the stars.
S&P 500 2134-37 is expected by Monday next week, March 30. Thursday and Friday this week should be up huge. There is evidence that yet another minor top is due on April 2nd, but it should mostly be in the NASDAQ and Dow Industrials, not the S&P 500 (but could be). This is based on a recurring 23 trading day cycle top (every act in the market has a reaction in same).
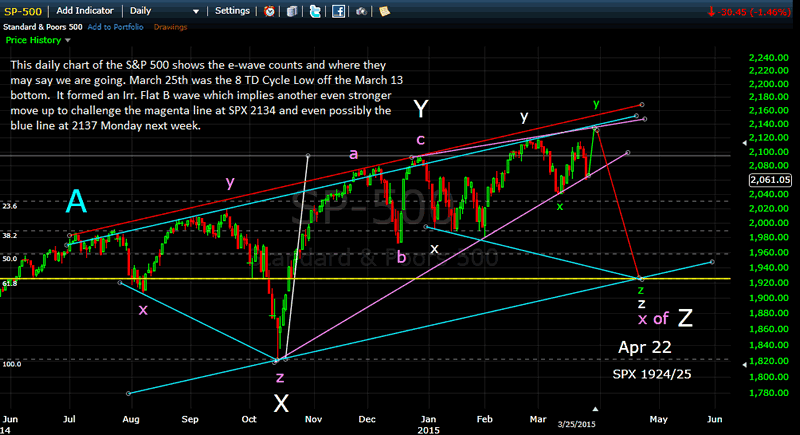
The first chart below shows the daily S&P 500 in macro format, from the time of the A Wave top in early July last year to the projection into April 22 to 1924/25(on the S&P 500). The April 22 projected low is an important signature on the Bradley. It is also 55 trading days (the 10 week cycle a week) past the February 2 low and trading days (the 5 week cycle ) past the 20 week low on March 13. It is also a .618 retracement of the a-b-c "Y" Wave ending on Dec 29, 2014.
Notice also the perfect symmetry of the current channel. The upper red line is just that "Red Lining" the market. The blue rising upper line is where there tends to be reasonable topping formations, especially secondary in nature before a fall of import.
The e-waves at this point get very complex and Z Waves can exhibit x-y-z formations of their own. Notice also the rising wedge formation. The market will fall like a waterfall once this formation is broken in earnest.
The whole formation going into April suggests even higher highs into early May, July and even into late August with a lot of choppiness and huge moves both up and down (I'll get into that later on). The bottom line is I believe we see a 20%+ bear market from late August into late October. But that will only be Wave X of a larger WAVE "B" due sometime in 2017 (Wave Z). That means higher highs (Wave Y) into 2016 are likely before we see an even bigger drop in a couple of years.
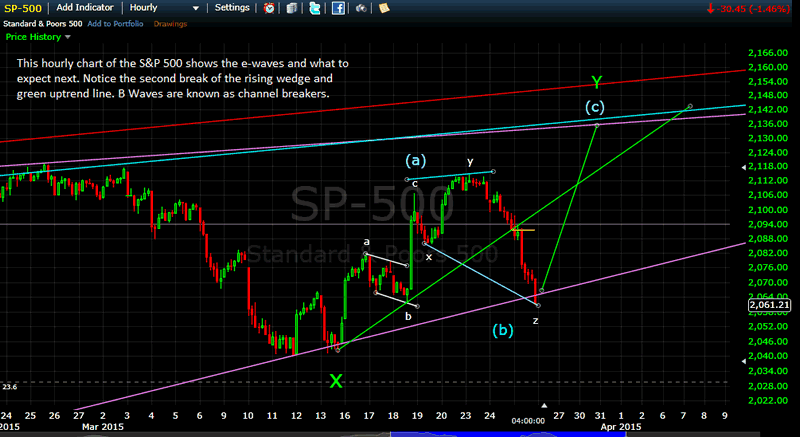
Below is the hourly chart of the S&P 500 and its projection. The pull back on March 25 was just the set-up for a higher high ahead (actually new highs). Elliott termed it an Irregular Flat with strong rally potential. Notice Wave (b) took out the former wave c of (a). This was the whole FED rally last week... gone....poof.
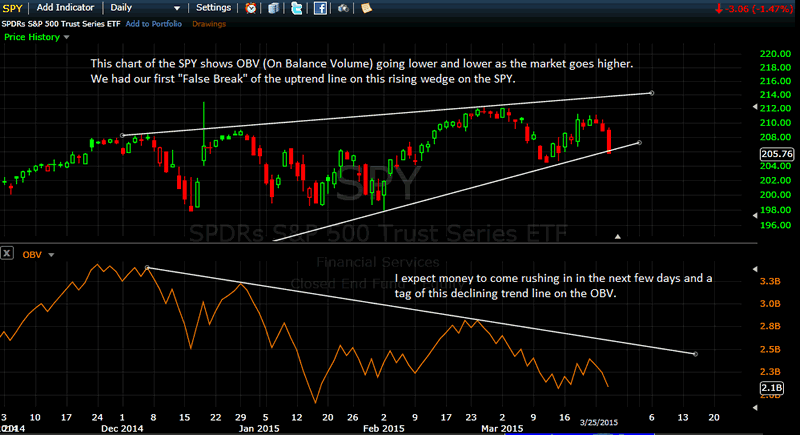
Below, as promised, I have the daily On-Balance-Volume chart for the SPY. It keeps going down as the market goes up. Eventually, the piper must be paid!
There is yet another important Bradley turn due on April 3 along with some other important astro aspects that imply an important turn. April 3rd is Good Friday, so I expect the turn (top) the day before. All in all, I expect next week to be quiet once the rally into Monday occurs. We have month end/beginning month seasonal buying and the end of the quarter buying expected to come in. It is after Easter that I expect the fireworks to the down side to occur in earnest. The next cycle bottom (the 4/8/16 td day low) is due around April 8 . Then we have April 22!
Brad Gudgeon
Editor of The BluStar Market Timer
The BluStar Market Timer was rated #1 in the world by Timer Trac in 2014, competing with over 1600 market timers. This occurred despite what the author considered a very difficult year for him. Brad Gudgeon, editor and author of the BluStar Market Timer, is a market veteran of over 30 years. The website is www.blustarmarkettimer.info To view the details more clearly, you may visit our free chart look at www.blustarcharts.weebly.com Copyright 2015. All Rights Reserved
Copyright 2015, BluStar Market Timer. All rights reserved.
Disclaimer: The above information is not intended as investment advice. Market timers can and do make mistakes. The above analysis is believed to be reliable, but we cannot be responsible for losses should they occur as a result of using this information. This article is intended for educational purposes only. Past performance is never a guarantee of future performance.
© 2005-2022 http://www.MarketOracle.co.uk - The Market Oracle is a FREE Daily Financial Markets Analysis & Forecasting online publication.