


Stocks Bull Market Continues
Stock-Markets / Stock Markets 2015 Mar 22, 2015 - 12:00 PM GMTBy: Tony_Caldaro

 The market started the week at SPX 2053. On Monday the market gapped up and hit SPX 2083. Then after two gap down openings the market pulled back to SPX 2061 by Wednesday, before the FOMC statement. After a strong Wednesday afternoon rally, the market gapped down on Thursday, but rose into a Friday high of SPX 2114. For the week the SPX/DOW gained 2.40%, the NDX/NAZ gained 3.25%, and the DJ World index gained 3.25%. On the economic front reports continue to come in slightly negative. On the uptick: industrial production, building permits, leading indicators, the WLEI and the monetary base. On the downtick: the NY/Philly FED, capacity utilization, the NAHB, housing starts, current account deficit, and weekly jobless claims. Next week we get updates on Q4 GDP, the CPI and more Housing reports.
LONG TERM: bull market
The six year bull market came within six points of matching its all time high of SPX 2120 this week. While the market has been quite choppy during 2015 it continues to work its way higher. Our long term count remains unchanged. A cycle wave [1] bull market underway, probably lasting until 2017, unfolding in five Primary waves. Primary waves I and II completed in 2011 and Primary wave III has been underway since then.
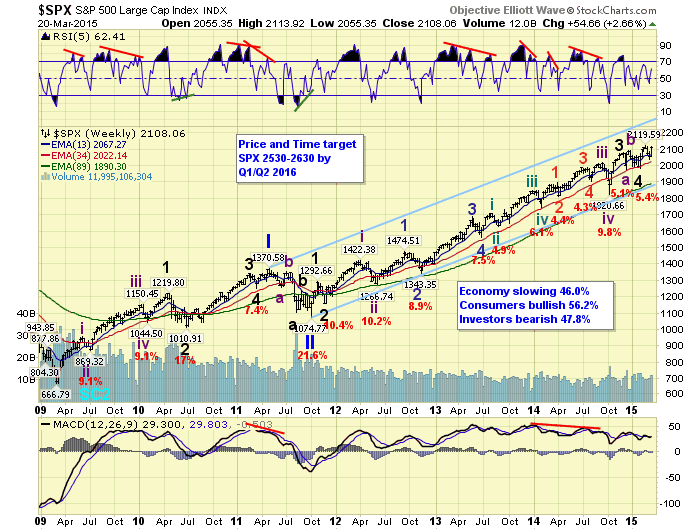
Primary I divided into five Major waves, with a subdividing Major wave 1 and simple Major waves 3 and 5. Primary III is doing just the opposite, with a simple Major wave 1 and subdividing Major waves 3 and 5. Major waves 1 and 2 completed in late 2011, and Major waves 3 and 4 completed in late-2014 to early-2015. Major wave 5 is currently underway. When it concludes, which we believe will be next year, Primary III will complete. Then after a Primary IV correction, a Primary wave V to new highs should follow.
MEDIUM TERM: uptrend
After a Major wave 4 bottom at SPX 1981 on the first trading day of February, the market rallied to 2120 by late-February. Since the wave was quite small for uptrend standards, only 7%, we counted that rally as Minor wave 1 of the Intermediate i uptrend. The market then pulled back for two weeks hitting SPX 2040, for a bit more than a 50% retracement. At the low it found support just below our SPX 2042-2072 wave structure range, and between our 2034-2051 Fibonacci range. And, it was quite oversold on the daily RSI and had dipped just below neutral on the MACD.
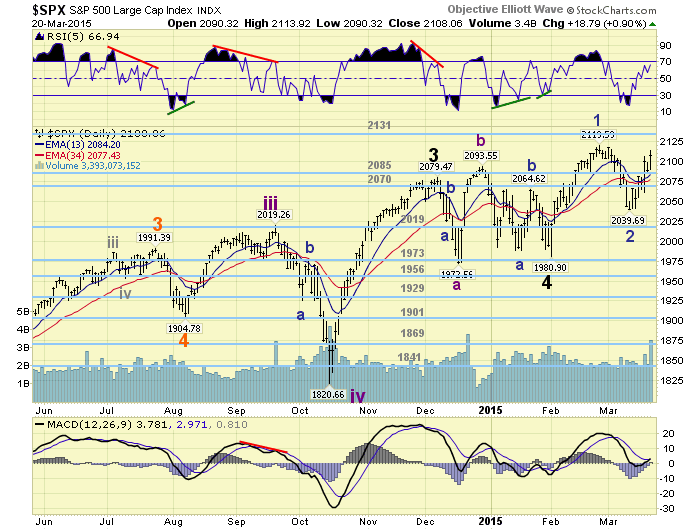
Since that low the market has rallied, with 20+ pullbacks along the way, to within six points of the all time high of SPX 2120 on Friday. We are counting this advance as Minor wave 3 of the uptrend. Since Minor wave 1 rose about 140 points (1981-2120) we are expecting Minor waves 3 through 5 to rise at least 140 points as well. This would put an upside target, for this uptrend, around at least SPX 2180. Since this is close to our OEW 2198 pivot, we would expect that range to be the minimum going forward. Medium term support is at the 2085 and 2070 pivots, with resistance at the 2131 and 2198 pivots.
SHORT TERM
During the Minor wave 2 pullback we counted it as a somewhat complex zigzag: 2088-2104-2040. At SPX 2040 the ‘c’ wave was exactly twice the ‘a’ wave. Then from an extremely oversold short term condition the market started to rally. The first advance to SPX 2066 was followed by nearly a full retracement pullback to 2041. However, the market held that low and then advanced to SPX 2081. The pullback that followed that rally was also a bit odd: 2065-2079-2061. Then the market took off on FOMC day to SPX 2107 and had another steep pullback to 2086. This was followed by a rally to SPX 2114 on Friday, and then a small pullback into the close.
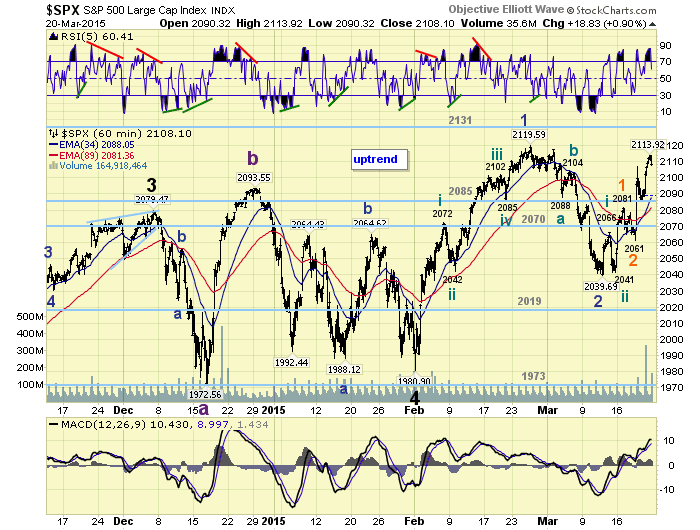
We are counting all this wave activity as a Minute i-ii (2066-2041) of Minor 3. Then a Micro 1-2 (2081-2061) of Minute iii, followed by a Micro 3 underway to 2114 thus far. For now the rally from SPX 2061 to 2114 appears to be part of Micro wave 3. Short term support is at SPX 2107 and the 2085 pivot, with resistance at SPX 2120 and the 2131 pivot. Short term momentum ended the week above neutral.
FOREIGN MARKETS
The Asian markets were nearly all higher and the net gain was 2.2% on the week.
The European markets were also nearly all higher gaining 1.7% on the week.
The Commodity equity group were all higher gaining 4.2% on the week.
The DJ World index gained 3.25% on the week.
COMMODITIES
Bonds appear to have reversed a downtrend gaining 1.2% on the week.
Crude appears to have bottomed gaining 3.5% on the week.
Gold appears to have reversed a downtrend too gaining 2.3% on the week.
The USD appears to have ended its 10 month uptrend as it lost 1.3% on the week.
NEXT WEEK
Monday: Existing home sales at 10am, and a speech from FED vice chair Fischer at 12:30. Tuesday: the CPI, FHFA home prices and New home sales. Wednesday: Durable goods orders. Thursday: weekly Jobless claims. Friday: Q4 GDP (est. +2.4%), Consumer sentiment, a speech from FED vice chair Fischer, and a speech from FED chair Yellen. Best to your weekend and week!
CHARTS: http://stockcharts.com/public/1269446/tenpp
http://caldaroew.spaces.live.com
After about 40 years of investing in the markets one learns that the markets are constantly changing, not only in price, but in what drives the markets. In the 1960s, the Nifty Fifty were the leaders of the stock market. In the 1970s, stock selection using Technical Analysis was important, as the market stayed with a trading range for the entire decade. In the 1980s, the market finally broke out of it doldrums, as the DOW broke through 1100 in 1982, and launched the greatest bull market on record.
Sharing is an important aspect of a life. Over 100 people have joined our group, from all walks of life, covering twenty three countries across the globe. It's been the most fun I have ever had in the market. Sharing uncommon knowledge, with investors. In hope of aiding them in finding their financial independence.
Copyright © 2015 Tony Caldaro - All Rights Reserved Disclaimer: The above is a matter of opinion provided for general information purposes only and is not intended as investment advice. Information and analysis above are derived from sources and utilising methods believed to be reliable, but we cannot accept responsibility for any losses you may incur as a result of this analysis. Individuals should consult with their personal financial advisors.
Tony Caldaro Archive |
© 2005-2022 http://www.MarketOracle.co.uk - The Market Oracle is a FREE Daily Financial Markets Analysis & Forecasting online publication.