Cheap Paper Money - Precious Metals Technical Outlook
Commodities / Commodities Trading Mar 20, 2015 - 02:15 PM GMTBy: Submissions
 Andy Farida writes: Central bankers are facing the most difficult task – balancing the economy which is on the verge of deflation or pumping it with cheap money to reflate the stitch up economic bubble. Worryingly there is no other option at hand and more negative interest rates in developed economies are looking likely in the coming months (especially in Europe). Meanwhile, the US economy (dubbed the Promised Land) continues to spur on the relentless task of spearheading growth and potentially raise interest rate for the first time. Analysts reckon that the BOE is running second on this issue too.
The big question that many precious metal investors had in mind is when will we see the trickle down event starts going into commodities again? To be fair, the last Precious Metal Bull Run was on the back of cheap money printed by the US government and this QE baton has been passed and replicated elsewhere such as Japan, China, Russia and Europe. Precious metal prices in other currencies have managed to make all time high and will continue to do so for a while. The momentum in XAU/USD looks ominously lower as the Fed looks to tighten in 2015. There is no denying that it will eventually happen and trading XAU below $ 1050 is looking more likely.
The next few months will be crucial for the US dollar and stock market bulls. 2015 has been a promising year for more than just a black swan event and at the speed it is going, it looks like there are MOAR around the corner.
Gold Technical Outlook
Weekly Chart
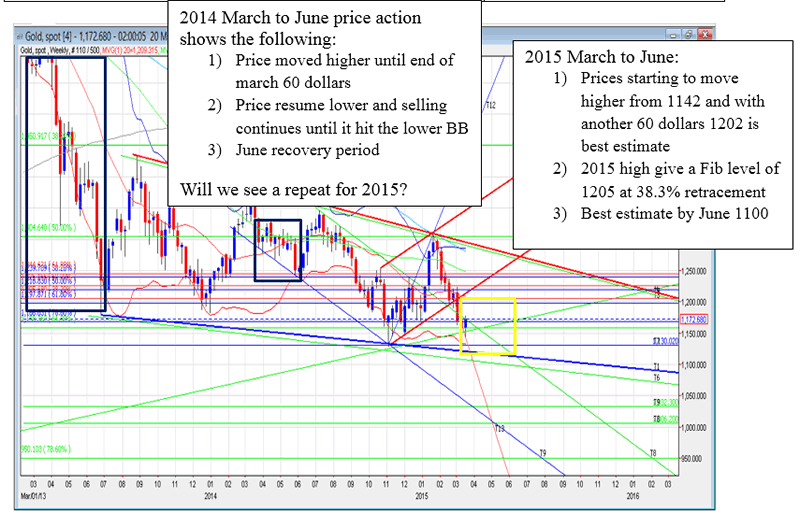
Gold registered a low at $ 1142.67 and bears continue to hold the upper hand. Only a break and close above $ 1195 will neutralise our view but anything below this are selling opportunities. Weakness in USD gave rooms for short covering and current price action suggests a pause by the sellers. This week, we will see a higher rebound of sort but wary of this bear trap!
Trade: Adding more short at $ 1196 with the stop changed to $ 1206. Valid for this week only. |
Contract |
Valid Date |
Price |
Action |
Stop Loss |
Target |
Results |
XAU |
23rd – 27th Feb |
1206 |
Closed |
1248 |
1189 |
+17 |
XAU |
23rd – 27th Feb |
1211 |
Closed |
1248 |
1177 |
+34 |
XAU |
23rd – 27th Feb |
1215 |
Closed |
1189 (1248) |
1152 |
+63 |
XAU |
16th – 20th Mar |
1178 |
Live |
1206 (1196) |
1150 |
|
XAU |
23rd – 27th Mar |
1196 |
Order Placed |
1206 |
1130 |
|
20 WMA |
50 WMA |
100 WMA |
1209 () |
1248 (-3) |
1282 (-2) |
Silver Technical Outlook
Weekly Chart
Silver bears lost its mojo despite being so close to break previous low. US dollar weakness (losses) was the main reason for a counter trade as investors start to cover their shorts. Overall trend remain bearish but current price action suggest a period of consolidation as previous low remains the potential target. Meanwhile, development in the currency market will give us more clues to the next possible direction on this trade.
A bullish engulfing candlestick on the weekly chart will give time for both bears and bulls to mull over. In addition, the WMA (see table below) has also lose its bearish momentum and further short covering could neutralise it. Despite that, we maintain our view that this rally is an opportunity to build on short positions.
Trade: Our Short silver position is looking less favourable thus we look to change our target. Any opportunity to close at breakeven is highly advised. Valid this week. |
Contract |
Valid Date |
Price |
Action |
Stop Loss |
Target |
Results |
XAG |
23rd -27th Feb |
16.70 |
Closed |
16.70 |
16.10 |
0 |
XAG |
23rd -27th Feb |
16.80 |
Closed |
16.66 |
15.55 |
+125 |
XAG |
16th – 20th Mar |
15.95 |
Live |
16.35 |
15.80 (15.30) |
|
20 WMA |
50 WMA |
100 WMA |
16.52 (-4) |
17.31 (-8) |
18.59 (-7) |
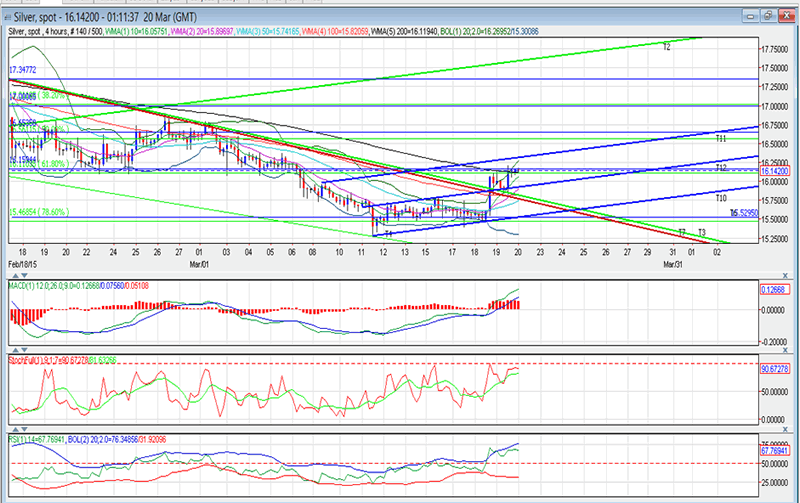
4 Hour Chart – Short covering rally but with a potential to build a short term bullish scenario.
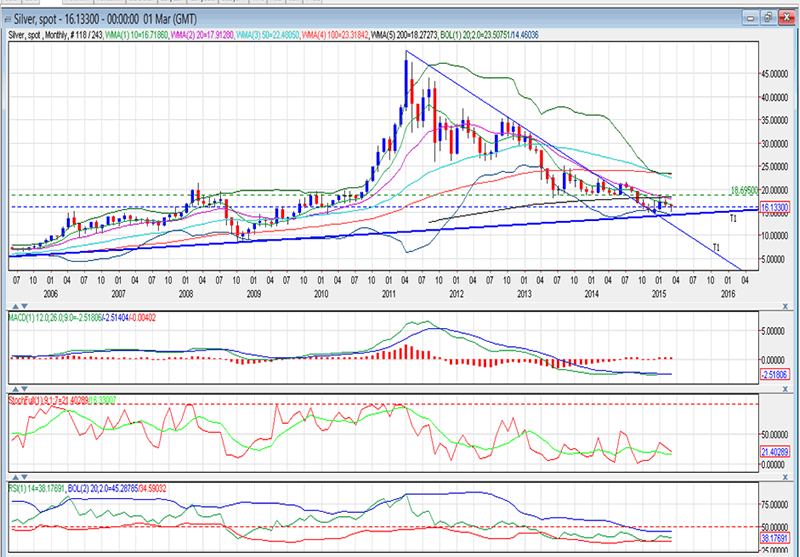
Monthly Chart – Watching the long term trend line acting as support for now at $ 14.65 and rising. The big question is what IF it broke lower?
Platinum Technical Outlook
Weekly Chart
Weekly low registered at $ 1086.20 and with the market trending lower, we cannot rule out lower prices in the near future. Daily Chart shows a compelling trend lines and on this basis, only short covering action will allow the market to test the upper trend line between $ 1143 to $ 1148 areas. In addition, the daily 20 MA will act as 1st resistance where sellers will prevail. Bears are still in full control and we felt that Platinum will further consolidate but any rallies are selling opportunities with a potential target of $ 1050 for long term support.
Trade: Short at $ 1147.50 with a stop at $ 1152 and target $ 1090. Valid this week only. |
Contract |
Valid Date |
Price |
Action |
Stop Loss |
Target |
Results |
Pt |
09th -13th Mar |
1155 |
Closed |
1150 |
1172 |
-5 |
Pt |
23rd – 27th Mar |
1147.5 |
Order Placed |
1152 |
1090 |
|
20 WMA |
50 WMA |
100 WMA |
1201 (-6) |
1322 (-6) |
1374 (-4) |
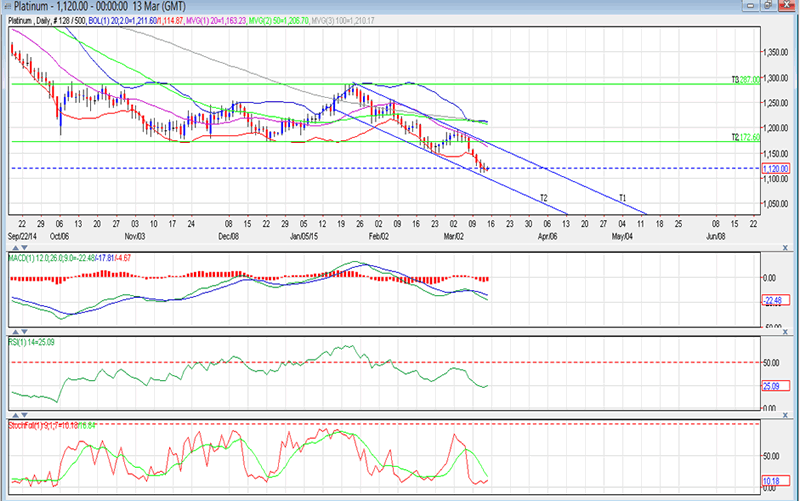
Daily Chart – Notice the Trend Line. We expect prices to continue in this trend.
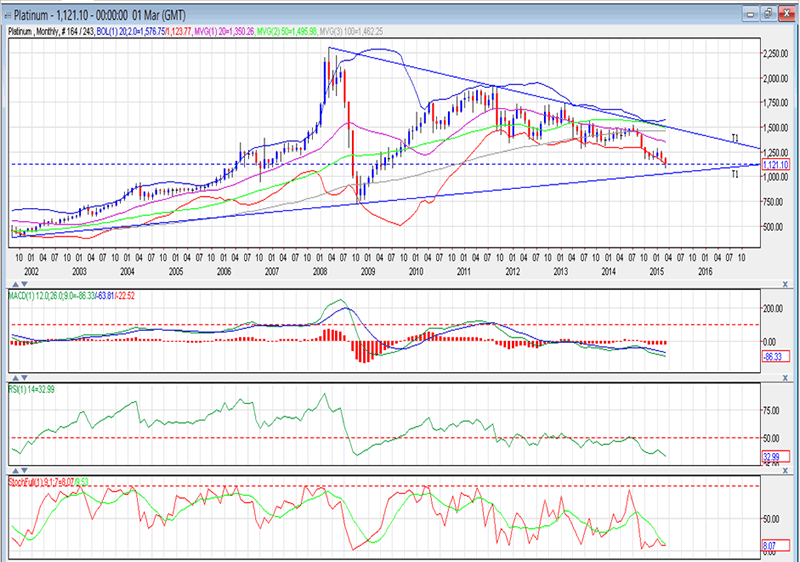
Monthly Chart – Potential setup for a period of short covering but aware that upside remains capped.
Palladium Technical Outlook
Weekly Chart
Last week we covered Palladium with the following take “…bearish scenario happens only if prices continue in this selling phase. A break and close at $ 773 will give the bear further impetus to take prices to test the lower Bollinger Bands at $ 754.39 (as of the time of writing). Pullback to the lower range of the trend line at $ 755 area may give investors an opportunity to buy in.”
Palladium bounced off the lower Bollinger Band after hitting a low of $ 754.20. Other indicators are pointing to more selling next week and only a move above $ 788 will help neutralise the current weakness. However, the long term view and upside looks capped and we are biased to see more consolidation before Palladium make any significant move. We favoured a period of range trading with a downside risk.
Trade: Risky short at $ 793 stop at $ 801.50 to target $ 760. Valid for this week only. |
Contract |
Valid Date |
Price |
Action |
Stop Loss |
Target |
Results |
Pd |
23rd – 27th Mar |
793 |
Order Placed |
801.50 |
760 |
|
20 WMA |
50 WMA |
100 WMA |
788 (-1) |
811 () |
769(+2) |
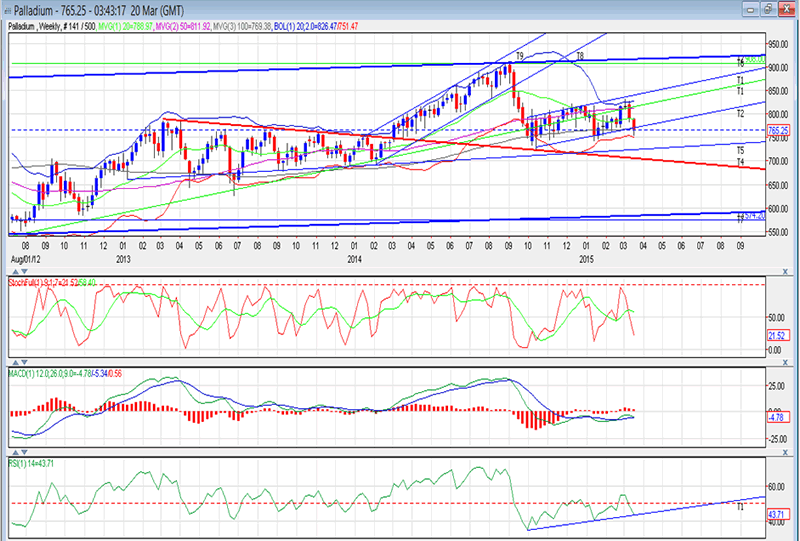
Weekly Chart – Current range is at risk of rollover – break and close below $ 750 opens the gate to retest $ 726
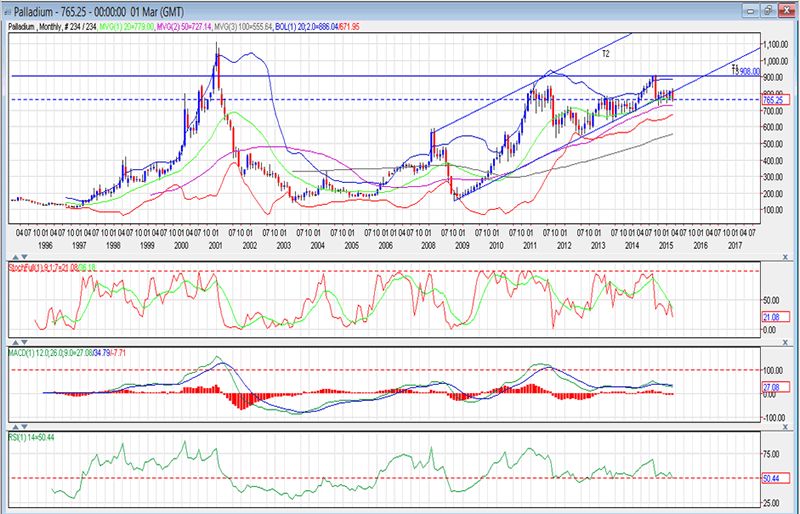
Monthly Chart – RSI just managing to hit 50 while other indicators are showing more weakness. Upside capped at $ 908.00 but anything higher then look for a new ALL TIME High.
By Andy Farida – CFTe
Contact e-mail address: andy.farida@sharpspixley.com
Position: Contributing Precious Metal Analyst
Bio: A critical thinker, learner, precious metal enthusiast and market analyser – mainly a technical overview through weekly chart.
Short Bio: A bookworm and have a high sense of curiosity in everything.
Social profiles: ;@sugardaddyFED (twitter), uk.linkedin.com/in/andyfar (Linkedin). http://news.sharpspixley.com/news/andy-farida/ (Sharpspixley.com)
This article is written according to the author’s views and by no means indicates investment purpose. Opinions expressed at Sharps Pixley Ltd are those of the individual authors and do not necessarily represent the opinion of Sharps Pixley Ltd or its management, shareholders, affiliates and subsidiaries. Sharps Pixley Ltd has not verified the accuracy of any claim or statement made by any independent writer and is reserved as their own and Sharps Pixley Ltd is not accountable for their input. Any opinions, research, analysis, prices or other information contained on this website, by Sharps Pixley Ltd, its employees, partners or contributors, is provided as general market commentary and does not constitute investment advice. Sharps Pixley Ltd will not accept liability for any loss or damage, including without limitation to, any loss of profit, which may arise directly or indirectly from use of or reliance on such information. The data contained on this website is not necessarily real-time or accurate.
Copyright © 2015 Andy Farida - All Rights Reserved Disclaimer: The above is a matter of opinion provided for general information purposes only and is not intended as investment advice. Information and analysis above are derived from sources and utilising methods believed to be reliable, but we cannot accept responsibility for any losses you may incur as a result of this analysis. Individuals should consult with their personal financial advisors.
© 2005-2022 http://www.MarketOracle.co.uk - The Market Oracle is a FREE Daily Financial Markets Analysis & Forecasting online publication.


