Stock Market FTSE 100: New Record Highs In Store?
Stock-Markets / Stock Markets 2015 Mar 05, 2015 - 08:18 PM GMTBy: Richard_Cox
 Stock markets continue to impress and the bull run in the FTSE 100 has its sights set on the 7,000 level. With price activity trading this close to a clearly defined psychological level, it would not be at all surprising to see an upward break. But the real question is whether or not a move like this would actually show sustainability in the coming months. This is a critical question for those that are considering long exposure while valuations are trading at such elevated levels. Clearly market momentum is still positive but traders entering late still run the risk of being caught long at the wrong market price. For these reasons, newer investors must assess the underlying strength of the blue chip stocks that actually make up the FTSE 100.
“For the most part, individual stock stories in the blue chip sector have been encouraging,” said Michael Carney, markets analyst at TeachMe Trading. “Two key examples here can be found in Aviva and Friends Life which posted quarterly earnings results that were well above market expectations.” Both of these stock stories were high encouraging and they helped to stoke the optimism that has characterized market activity for most of this year. Since we are now in the midst of earning season, it appears as though markets will only need a few more stories like this to gain the momentum it needs to finally break the 7,000 level. Needless to say, this would be a highly bullish event and we will probably start to see even more attention in the financial media starting to focus on the long-term rallies in the FTSE 100.
For these reasons, it will be highly important for new investors to have some sense of the historical price activity in the FTSE 100. This will likely be the best way of determining where buy entries should be placed if you are an investor that is looking to capitalize on the positive momentum seen in the UK’s foremost stock benchmark. Here, we will take a closer look at that recent price history.
_____________________________________
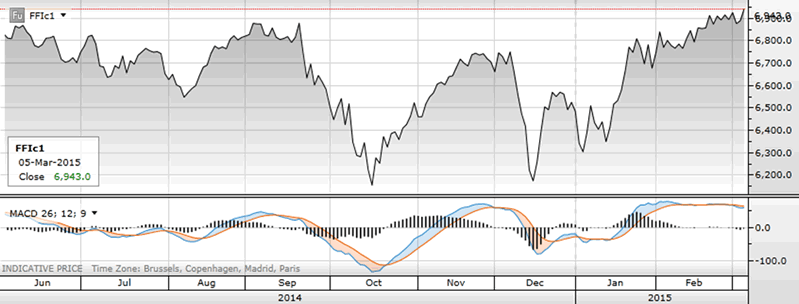
FTSE 100
Critical Resistance: 7000
Critical Support: 6850
Trading Bias: Bullish

(Chart Source: CornerTrader)
FTSE 100 - Stock Index Trading Strategy: Momentum still firmly in bullish territory but starting to reach overbought territory. Wait for corrective pullbacks before establishing new long positions to improve on excess risk levels.
From the chart perspective, there is some very interesting activity in the FTSE 100. Markets have attempted to break through the closely watched 7,000 level on several occasions, only to be forcefully rejected before accomplishing this. We are now embarking on yet another attempt on this important psychological barrier and it is generally unlikely that resistance levels hold up after multiple tests.
In any cause, indicator readings have shown that prices are becoming overbought, so this suggests that traders should exercise patience before jumping into these markets at current levels. In other words, the bull trend for the FTSE 100 is still firmly in place, but it is better to take a conservative stance and allow prices to fall back a bit before going long. The first level to watch in this regard is 5850, and this is a price area that is likely to see buying activity given its previous role as a level of resistance.
By Richard Cox
© 2015 Richard Cox - All Rights Reserved
Disclaimer: The above is a matter of opinion provided for general information purposes only and is not intended as investment advice. Information and analysis above are derived from sources and utilising methods believed to be reliable, but we cannot accept responsibility for any losses you may incur as a result of this analysis. Individuals should consult with their personal financial advisors.
© 2005-2022 http://www.MarketOracle.co.uk - The Market Oracle is a FREE Daily Financial Markets Analysis & Forecasting online publication.


