Sugar Commodity Price To Sweeten Up
Commodities / Commodities Trading Feb 25, 2015 - 01:00 PM GMTBy: Austin_Galt
 The sugar price has been shellacked over recent years but, if my analysis is correct, it is set to sweeten up over the coming months.
Let’s mix it up and begin with the monthly chart.
SUGAR MONTHLY CHART
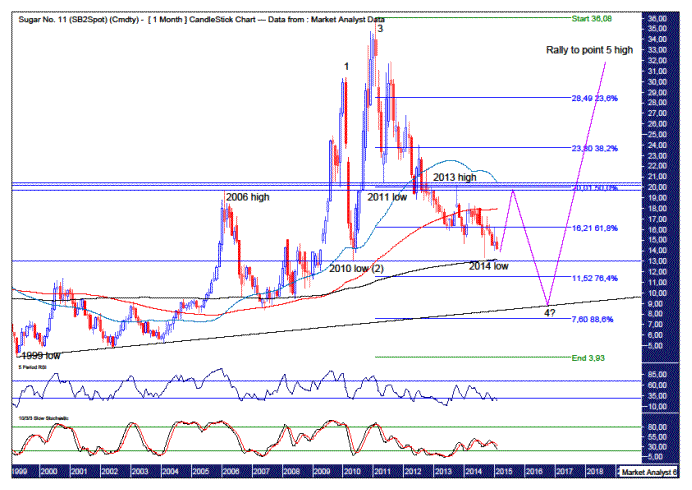
The lower horizontal line denotes a double bottom stemming from the 2010 low at US$13 and 2014 low at US$13.32. Price has already rallied a little but I expect a bigger reaction off this level.

The 2014 low was also at support given by the 200 period moving average which is denoted by the black line.
The 2014 low, set in September, showed a bullish divergence on the Relative Strength Indicator (RSI) and Stochastic indicator. Both indicators are back around oversold territory and I favour a more substantial rally to commence shortly.
There are a cluster of horizontal lines which pertains to the 2006 high, 2011 low and 2013 high. I expect this area to provide heavy resistance to any rally and I doubt the coming expected rally will be able to overcome that resistance.
This resistance area is also right around the 50% Fibonacci retracement level of the move up from the 1999 low to all time high and stands at US$20.01. So I expect any rally to turn back down around that level.
And perhaps the rally high will be also be around resistance given from the 50 period (blue) or 100 period (red) moving averages.
Once the rally high is in place I expect a move back down to new lows below the double bottom support.
How low is price likely to trade?
I am looking for price to trade down to at least the 76.4% Fibonacci retracement level at US$11.52 and possibly as low as the 88.6% level at US$7.60. I doubt price will trade lower than that.
Also, I have drawn an uptrend line from the 1999 low and perhaps price will find support there. That looks to be somewhere between the 76.4% and 88.6% levels over the next few years.
This scenario sets up a big 5 point broadening top with the 2010 top point 1, the 2010 low point 2 and the 2011 top point 3. The coming low will be point 4 before price heads back up for the point 5 high.
Let’s now zoom out for the a different perspective with the yearly chart.
SUGAR YEARLY CHART
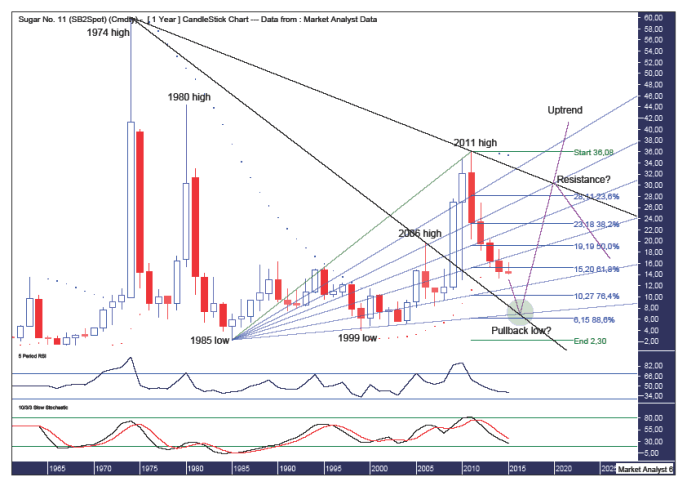
Both the RSI and Stochastic indicator are trending down and in weak territory. Nothing for the bulls to get excited about there.

The Parabolic Stop and Reverse (PSAR) indicator has a bearish bias after price busted the dots on the downside last year. More downside looks in store to my eye.
I have added a different set of Fibonacci retracement levels starting from the 1985 low. I am looking for price to retreat to at least the 76.4% level at US$10.27 but doubt price will trade as low as the 88.6% level at US$6.15. Somewhere in between perhaps.
I have drawn a Fibonacci Fan from the 1985 low to 2011 high. Looking retroactively, this fan shows some nice symmetry with price. The 1999 low and subsequent lows found support at the 88.6% angle. The 2006 high found resistance at the 38.2% angle while the following year found support at the 76.4% angle. Perhaps the final low will find support at the 88.6% angle once again.
I have drawn a downtrend line connecting the 1974 high with the 2006 high. Perhaps price will find support at this trend line. I have drawn a green highlighted circle to show where this trend line meets the 88.6% Fibonacci Fan angle and is just above the 88.6% Fibonacci retracement level. This is more or less where I am targeting for final low.
Once the low is an. uptrend can commence which should make new highs above the 2011 high of US$36.08. I have drawn a downtrend line connecting the 1974 and 2011 highs and price may find resistance there. Let’s see.
Let’s wrap it up by looking in a bit closer with the weekly chart.
SUGAR WEEKLY CHART
From the monthly analysis, we know there is a double bottom and I am expecting a bigger rally to eventuate.

The recent move up from September 2014 low to October 2014 high was impulsive in nature and price has been correcting ever since.
The PSAR indicator is evidence of the corrective nature of trading with the dots being busted all over the place.
I have added Fibonacci retracement levels of this impulsive move higher and price has found support around the 76.4% level but I am looking for price to move a touch lower to put in the final pullback low. The 88.6% level at US$13.76 looms as a good candidate.
The RSI and Stochastic indicator are both showing a pattern of higher lows but will need a higher high to confirm the bullish pattern. Price moving back up shortly should do the trick.
The 100 period moving average, denoted by the red line, has already rejected price three times. I expect price to move up shortly and take out this moving average on the fourth attempt. As Gann noted, fourth attempts at support or resistance are usually successful.
I have drawn a horizontal line to denote the October 2013 high level which stands at US$20.16 and I doubt price will trade above there.
As for the timing, I suspect a low may form in a couple of weeks. An important Gann timing period is 150 days from a top or bottom and March 8th will be 150 days from the October 2014 high. That is on the weekend so the week before or after offer some potential.
Summing up, things have been pretty sour for sugar bulls in recent times but I expect a short term sweetener to relieve the bitterness.
By Austin Galt
Austin Galt is The Voodoo Analyst. I have studied charts for over 20 years and am currently a private trader. Several years ago I worked as a licensed advisor with a well known Australian stock broker. While there was an abundance of fundamental analysts, there seemed to be a dearth of technical analysts. My aim here is to provide my view of technical analysis that is both intriguing and misunderstood by many. I like to refer to it as the black magic of stock market analysis.
© 2015 Copyright The Voodoo Analyst - All Rights Reserved
Disclaimer: The above is a matter of opinion provided for general information purposes only and is not intended as investment advice. Information and analysis above are derived from sources and utilising methods believed to be reliable, but we cannot accept responsibility for any losses you may incur as a result of this analysis. Individuals should consult with their personal financial advisors.
Austin Galt Archive |
© 2005-2022 http://www.MarketOracle.co.uk - The Market Oracle is a FREE Daily Financial Markets Analysis & Forecasting online publication.


