5 Reasons Why You Should Sell Amazon Stock
Companies / Internet Feb 23, 2015 - 04:09 PM GMTBy: Submissions
 Amigo Bulls write: Amazon reported Q4 2014 earnings results in January 2015. The company which has always pursued a topline focused strategy failed to keep up with expectations on the revenue front missing estimates by 2%. Yet investors showed confidence with the Amazon stock gaining close to 12.2% on account of beating earnings estimates. So what does this mean? Is it proof that investors are now valuing earnings growth over topline growth? The Amazon stock which went through a rough patch in 2014 has been on the rise since its Q4 results. Is it a time for Amazon investors to rejoice? We look at the top 5 reasons why the earnings was more than spectacular and the fundamental reasons behind why the stock is a sell.
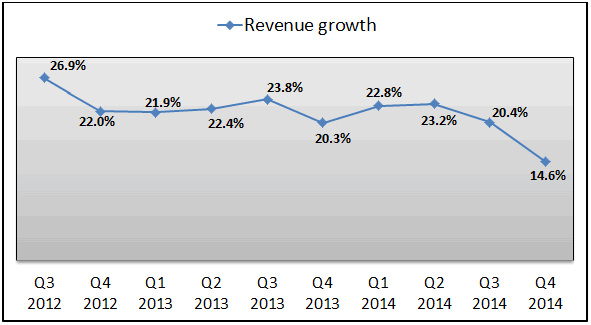
Amazon Topline Growth Slows
Let us take a look at the revenue growth in recent times (Fig 1). Amazon stock analysis reveals that the Q4 year-on-year revenue growth rate was the slowest reported in the last 10 years. These revenue estimates had already been lowered by 4% over the last three months. To add to this, Amazon operating expenses have continued to outgrow topline growth which means that the company’s reinvestments are not generating expected incremental sales.
Fig 1: Amazon YoY Revenue Growth Chart

Amazon Profitability Worsens
The company fared badly in 2014 reporting a Net Loss of $241 million, a drop of $500 million from 2013 (Amazon Net Income for 2013 was $274 million). In the latest quarter, the firm did report an earnings surprise of $0.45, way ahead of analyst estimates of $0.24 but we feel that it is nothing to cheer. Amazon has recorded profit margin contractions at the net as well as operating levels. Some numbers will put this in perspective:
- Gross profit margins stood at 2.3% in 2014 compared to 2.5% in 2013.
- Operating profit margin declined to -0.8% in 2014 versus -0.1% in 2013.
- Net income margin fell to -0.6% in 2014 compared to 0.4% in 2013.
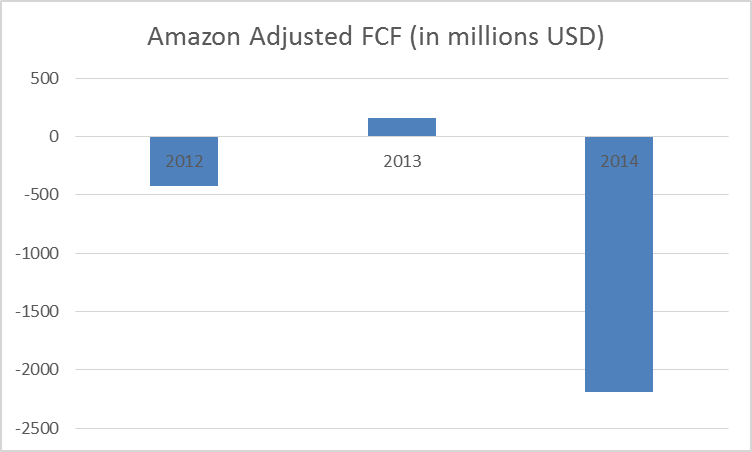
Decreasing Free Cash Flow
FCF adjusted for capital lease repayments and capital acquired under capital leases represents the cash available for discretionary expenditures at Amazon. This metric is moving downhill due to a combination of factors: Amazon is experiencing lower leverage on its reinvestments, plateauing of its DPO (Days of Payables outstanding) and rapidly increasing spends on acquiring assets under capital leases. Amazon is raising debt to meet its current commitments (leases, debt principal repayments and rising interest expenses), which is a confirmation of the poor health of the firms cash flows.
Fig 2: Amazon Adjusted FCF Chart

High PE ratio
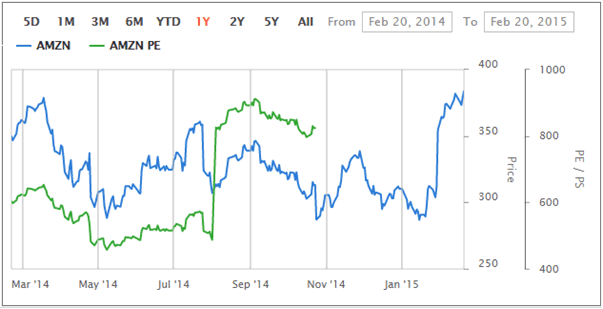
Fig 3: Amazon PE ratio chart by Amigobulls

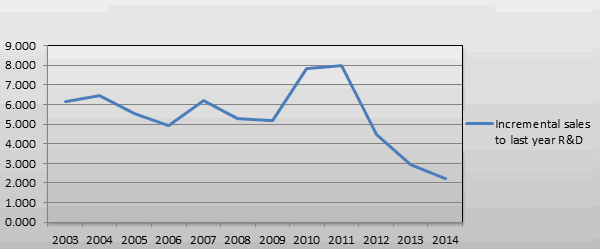
Amazon’s sky high PE ratio has always been the topic of much debate. Investors argue that if the company does not re-invest in R&D then the PE ratio would have been reasonable and close to industry average (See Fig 3). However a deeper analysis of Amazon’s expenses to topline growth reveals that the incremental sales to revenue has been trending downwards (Fig 4) over the last 3 years which means Amazons reinvestments into R&D are paying back lesser and lesser in terms of revenue growth, hence not justifying the high PE ratio.
Fig 4: Amazon incremental sales to last year R&D

Debt Is Increasing Alarmingly
Increasing debt only shows that the firm is no longer the cash machine it was touted as. As of December 31, 2014, the total long term debt stands at $8.27 billion, out of which $6 billion was raised in 2014 alone. This increasing debt and the associated interest repayments will only put pressure on the bottom line in the coming years, and given Amazon’s wafer thin profitability this looks like a daunting task.
Copyright © 2015 Amigo Bulls - All Rights Reserved Disclaimer: The above is a matter of opinion provided for general information purposes only and is not intended as investment advice. Information and analysis above are derived from sources and utilising methods believed to be reliable, but we cannot accept responsibility for any losses you may incur as a result of this analysis. Individuals should consult with their personal financial advisors.
© 2005-2022 http://www.MarketOracle.co.uk - The Market Oracle is a FREE Daily Financial Markets Analysis & Forecasting online publication.


