Climate Change Conundrum…Global Warming or Cooling? and US Dollar Update
Currencies / US Dollar Jun 05, 2008 - 02:12 AM GMTBy: David_Petch

 The effects of burning huge quantities of oil around the globe has been going on for over 100 years and now the bio-feedback mechanisms are just starting to be noticed. Trends such as this take hundreds or thousands of years to revert back to the mean. A present, oil shortages along with many other commodities are now in Contango, which is putting pressure on longer term pricing for those wishing to secure raw materials for production purposes (e.g. steel for cars, oats for cereal etc.).
We all know the US government has been spending more than it takes in for a long time and if the average American and Canadian practiced this sort of behaviour (it appears some have), they would be out on the street. Printing more money causes the cost of goods to rise and since the USD is still a reserve currency around the globe, this inflation spreads to every corner of it. When commodity prices rise, it pipes inflation right to everyone's doorstep. This has raised the cost of driving to the point where Americans are turning to mass transit . Some people are starting to refer to the rising prices in the US as the new Weimar experience .
Rising energy costs impact every aspect of our lives, no matter how trivial they may seem. One of the most important aspects is food . Not only do food supplies require being increased, but also the use of fossil fuel must increase in order to provide that 1 calorie of food on the dinner table. The one item often overlooked that plays an even greater role in determining the availability of food is the weather here on good old mother Earth.
Changing weather patterns have caused invasive species to take hold of certain ecosystems. This is by far one of the most critical factors for maintaining stability within ecosystems…disrupting the lower portion has tremendous impacts all the way to the top. Global warming (or cooling) causes changes in the weather pattern. This is all part of a biofeedback mechanism that is just starting to become visible to the general populous.
The prevalent mainstream theory to the disruptions being witnessed at the moment is due to global warming. This trend if it continues down the current path could impact crop yields and available water in the US . This trend is not just bound to the shores of North America but extends to all corners of the globe and in this one news piece, Europe . How does one combat global warming…it seems that humankind has an idea for everything, even global warming. Ecosystems are based upon thousands, tens of thousands, even hundreds of thousands of years of stability. By humankind jumping in to try and “fix” a situation, there are often unintended consequences .
The next theory of the global weather patterns is global cooling, which is in part regulated by the sunspot cycle. Visiting www.spaceweather.com , it is clearly evident there are no sunspots. The sunspot cycle was “supposed to have seen increased global drought until the cycle peaked in 2011 with massive solar disruptions to the electrical grids. This event did not happen, which draws to question that the next 10-20 years could see a global decline in temperatures by 4-5 o C. The year 2007 saw the global temperature decline by 0.7 o C. This does not sound like much but it is huge from a global perspective. Manitoba saw the month of May 2008 have temperatures 4 o C below normal, which has drastically reduced the growth of vegetation. It the trend continues this summer, there will be crops, albeit at reduced levels.
One other item often overlooked that triggered previous ice ages is the Gulf Stream . Recent evidence suggests the Gulf Stream has weakened by 30% over the past 12 years. This link suggests what “can” happen when the gulf stream slows down .
So, what happens, global warming or global cooling? I think the next 10-15 years are going to witness global cooling, which will later see a reversion to global warming from 2025, lasting up to 10-20 years. By 2025 the amount of CO 2 put into the atmosphere on a yearly basis will be reduced by 60-80%, so the item of focus beyond 2050 is a reversion to an ice age. Consider this if you will…If 3 feet/year of snow accumulates for 100 years, that is 300 feet, that could be compressed down to 20-25 feet. Multiply this by 500 to give a 5000 year period and 20 feet quickly becomes 2000 feet, just shy of ½ mile of ice.
The moment to focus on is now and the source of our life (the sun) is not casting sunspots on Earth. There will be reduced crop yields globally this year, so that 50% increase in food production mentioned earlier in the article is a pipe dream. I have not seen any 40 pound bags of Basmati rice at our store the past 3 weeks, which cost $39/bag at the time. There were 10 pound bags of Basmati, but priced at $17/bag…this would equate to a doubling in the price of rice. I met a pleasant elderly gentleman from India in the checkout line and he told me how “really bad” the rice shortages were over in India . One thing he mentioned is that the price of fuel is so high that the amount of crop waste is actually on the rise.
Our “just in time” economy delivers “fresh” fruit to our stores. When oil supplies tighten up and is not available for some, only dry crops, such as grains etc. can survive prolonged periods of time required for being transported around the globe. This goes for fish, unless it is dried out as those long ago did and ground up into powder for making a dinner paste when travelling. Times are a changing, so my advice is to grasp the reality of the situation at hand and embrace it for what it is worth rather than fighting the trend.
Many people are going to suffer hardships in the coming years from being unprepared…do not be one of them. Make sure investments in precious metal bullion, gold and silver stocks, energy stocks etc. are in place and of course, ensure that enough food is on hand in the event of any disruptions to the food supply.
The next bit of this article focuses on the US Dollar Index. I cover the AMEX Gold BUGS Index, AMEX Oil Index, 10 Year US Treasury Index and the S&P 500 Index on a weekly basis (also the USD as per below) but will not be updating these for some time due to preserving content for subscribers.
Update of the US Dollar Index
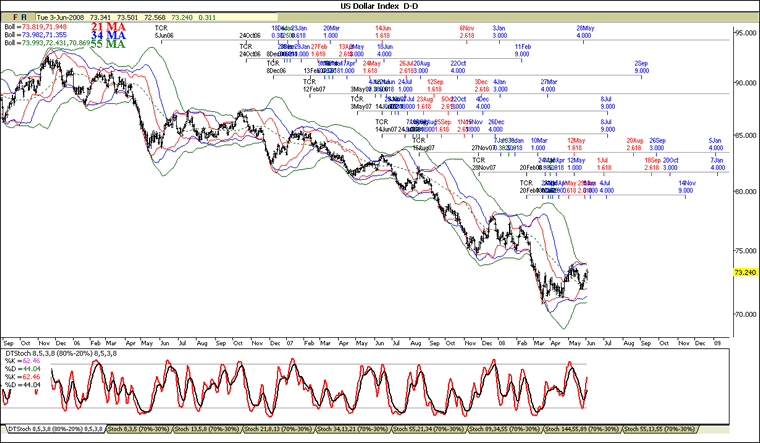
Fibonacci time extensions of various waves are shown near the top of the chart, with a cluster of Fib dates occurring in early July and again around mid September. Upper and lower Bollinger bands are in a setup for a continuation in the sideways action of the USD index. Short-term stochastics have the %K above the %D, with an estimated 7-10 trading days remaining in the uptrend before reversing.
Figure 1
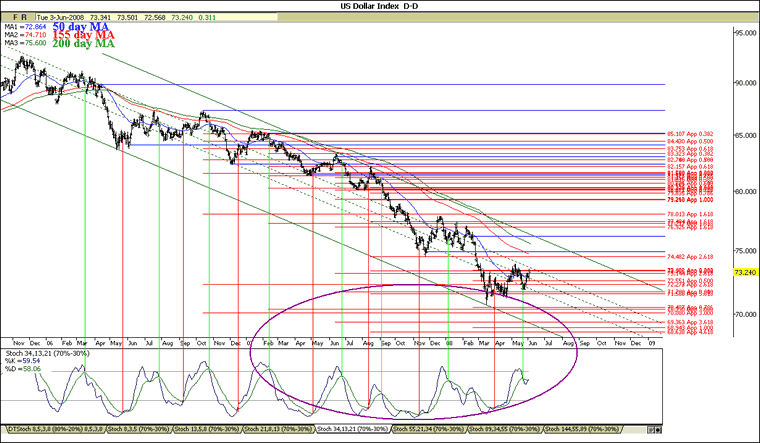
Red lines on the right hand side represent Fibonacci price projections of downward trending wave price action projected off the termination point of subsequent corrections. Areas of line overlap form Fib clusters, which indicate important support/resistance levels. The USD is butting up against strong resistance around 73.6…a move above this level suggests a potential move to 74.5-75. Moving averages are in bearish alignment (200 day MA above the 155 day MA above the 50 day MA), with the 50 day MA acting as support at 72.9. Full stochastics have the %K above the %D after curling back up to establish a lower rising trend line within the confines of a rounding bottom pattern. It is possible the trend could extend beyond the 2 week period as per Figure 1, but it would likely last no longer than 4 weeks. The bottom line: Expect the USD index to continue rallying for 2-4 weeks. This will be followed as per the weekly updates.
Figure 2
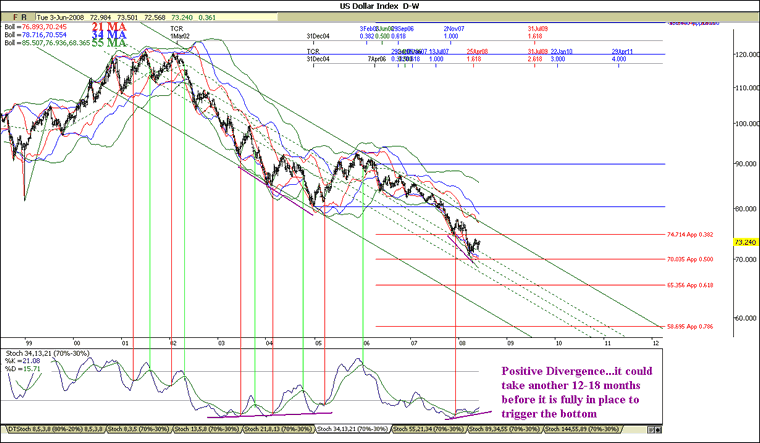
The weekly semi-log chart of the USD index is shown below, with Fibonacci time extensions of waves w and x shown at the top of the chart. Notice the cluster of Fib dates occurring on July 31st , 2009 that intersects the lower channel line of the Babson channel around the 58-60 level, depending upon how the channel line is drawn. Lower Bollinger bands have the 34 MA beneath the 21 MA BB, suggestive that at least 3-4 months is required at a minimum before the 21 MA BB rises above the 34 MA BB to trigger the next down leg in the dollar. Full stochastics have the %K above the %D, with an established rising trend line that formed a positive divergence relative to the index. It should be noted that the other positive divergence that occurred from late 2002 until the end of 2005 was 24 months…it took this long before the index responded to the trend. Expect this sort of time frame to be repeated before the present positive reversal has any traction.
Figure 3
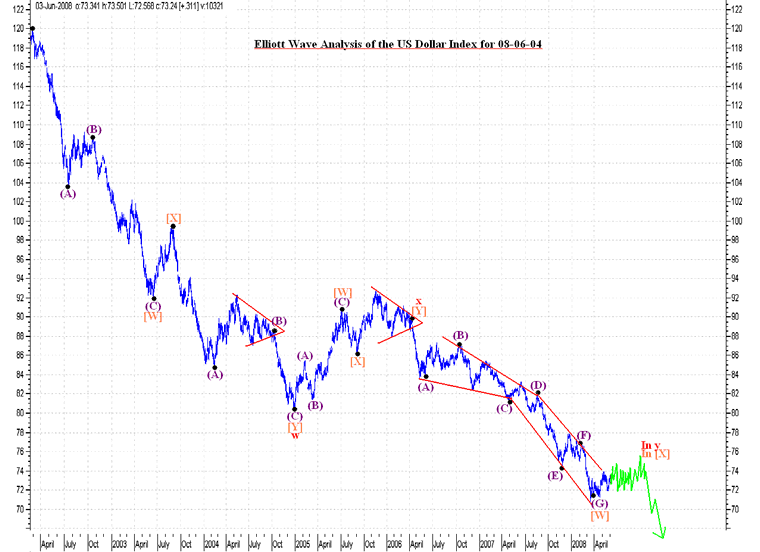
The Elliott Wave chart of the USD Index is shown below, with the thought pattern forming denoted in green. I expect the USD to remain buoyant for at least 3-4 months, possibly 6 months before wave [X] (that I coin a hinge between the waves [W].y and the wave [Y].y that has yet to form) terminates and leads way for the next leg down in the USD index…a bottom of 58-60 by July 31 st , 2009.
Figure 4
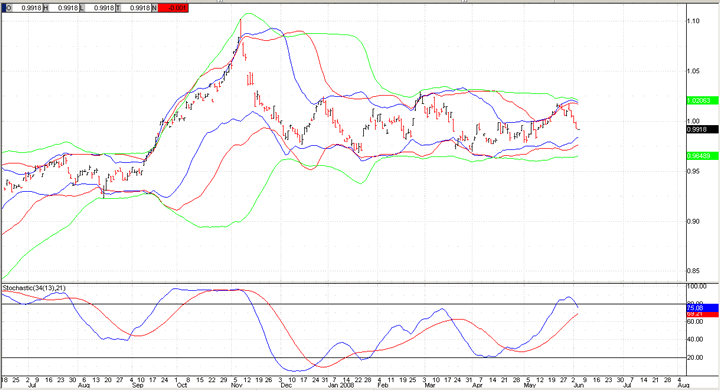
The Canadian dollar priced relative to the USD is shown below, with accompanying full stochastics. Notice how the CAD has been in a narrow trading range since December 2007. Full stochastics have the %K above the %D, but has curled down, suggestive that weakness could persist for at least 4-6 weeks. For those holding USD, take this advantage to transfer funds into other currencies such as the CAD while it remains in a narrow trading range. The next downleg in the USD should propel the CAD to around $1.20-1.25. Doing so will retain the purchasing power of money and allow “free” currency appreciation at the same time.
Figure 5
A major portion of the work I do is technically oriented, but I write 2-3 editorials per week often intertwined within the analysis . For further viewing of prior work, simply click on the Archive section of this site. I update the AMEX Gold BUGS Index, AMEX Oil Index, US Dollar Index, 10-Year US Treasury Index, S&P 500 Index as well as commentary on market-related issues and new technical analysis findings. We follow some 60 stocks, with a focus on core positions and stocks that actually make up our personal portfolio. As well, the keeper of the site, Captain Hook writes 3-4 articles per week discussing macro issues, ratio analysis of various markets and an in-depth study of put/call ratios and shorting candidates.
By David Petch
http://www.treasurechests.info
I generally try to write at least one editorial per week, although typically not as long as this one. At www.treasurechests.info , once per week (with updates if required), I track the Amex Gold BUGS Index, AMEX Oil Index, US Dollar Index, 10 Year US Treasury Index and the S&P 500 Index using various forms of technical analysis, including Elliott Wave. Captain Hook the site proprietor writes 2-3 articles per week on the “big picture” by tying in recent market action with numerous index ratios, money supply, COT positions etc. We also cover some 60 plus stocks in the precious metals, energy and base metals categories (with a focus on stocks around our provinces).
With the above being just one example of how we go about identifying value for investors, if this is the kind of analysis you are looking for we invite you to visit our site and discover more about how our service can further aid in achieving your financial goals. In this regard, whether it's top down macro-analysis designed to assist in opinion shaping and investment policy, or analysis on specific opportunities in the precious metals and energy sectors believed to possess exceptional value, like mindedly at Treasure Chests we in turn strive to provide the best value possible. So again, pay us a visit and discover why a small investment on your part could pay you handsome rewards in the not too distant future.
And of course if you have any questions, comments, or criticisms regarding the above, please feel free to drop us a line . We very much enjoy hearing from you on these items.
Disclaimer: The above is a matter of opinion and is not intended as investment advice. Information and analysis above are derived from sources and utilizing methods believed reliable, but we cannot accept responsibility for any trading losses you may incur as a result of this analysis. Comments within the text should not be construed as specific recommendations to buy or sell securities. Individuals should consult with their broker and personal financial advisors before engaging in any trading activities as we are not registered brokers or advisors. Certain statements included herein may constitute "forward-looking statements" with the meaning of certain securities legislative measures. Such forward-looking statements involve known and unknown risks, uncertainties and other factors that may cause the actual results, performance or achievements of the above mentioned companies, and / or industry results, to be materially different from any future results, performance or achievements expressed or implied by such forward-looking statements. Do your own due diligence.
Copyright © 2008 treasurechests.info Inc. All rights reserved.
Unless otherwise indicated, all materials on these pages are copyrighted by treasurechests.info Inc. No part of these pages, either text or image may be used for any purpose other than personal use. Therefore, reproduction, modification, storage in a retrieval system or retransmission, in any form or by any means, electronic, mechanical or otherwise, for reasons other than personal use, is strictly prohibited without prior written permission.
David Petch Archive |
© 2005-2022 http://www.MarketOracle.co.uk - The Market Oracle is a FREE Daily Financial Markets Analysis & Forecasting online publication.


