UK Good Deflation Election Boost for Conservatives But Inflation Mega-trend Remains Exponential
Economics / Inflation Feb 18, 2015 - 02:53 PM GMTBy: Nadeem_Walayat
 The latest UK official CPI inflation data is at an historic low rate of just 0.3% which prompted the mainstream financial press and academic economists to go overboard on commentary on the dangers of deflation, much as the Bank of England tends to propagandise in its quarterly inflation reports of why Inflation needs to be at or above 2% CPI. The press continues to warn of outright deflation later this year as CPI is expected to nudge below 0% and how this is bad for the economy as people put of consuming today in the anticipation of lower prices tomorrow.
However, firstly the average CPI inflation rate over the past 12 months is 1.35% and the average for the more recognised closer to reality RPI inflation rates 12 month average is 2.25%, so no, the UK does NOT facing deflation for the academics and journalists fail to realise the difference between good deflation and bad deflation. Good deflation is when prices fall as a result of lower material costs and increases in worker productivity as a consequence of the exponential trend in technological advancement i.e. the internet.
Whilst bad deflation is as a consequence of a contraction in economic activity i.e. a recession that translates into unemployment and falling wages, where the most recent data suggests is actually picking up with wages now rising at 2% per annum, their fastest pace for many years and above both official inflation indices.
Another major gaping hole in the understanding of the deflation / inflation debate is that there are literally £550 billion reasons why there is no real deflation nor will there be deflation, and that is the amount of debt that the Coalition government will have printed over its term in office, debt that will NEVER BE REPAID but rolled over in perpetuity, even the interest due is paid with more printed debt. Which is the primary reason why the UK will never experience sustained deflation because ALL government print debt to buy votes which causes inflation as illustrated by the ConLib's deficit forecast -
29th June 2010 - UK ConLib Government to Use INFLATION Stealth Tax to Erode Value of Public Debt
Therefore it is difficult to see how the government will be able to achieve its stated budget reduction target of getting the annual deficit down to just £20 billion by 2015-16. Whilst the government is expected to trend close to target for the next 3 years, however thereafter the governments (OFBR) and my deficit forecasts diverge as the coalition governments primary focus will be towards getting re-elected in May 2015. In all likelihood this means that total debt will be over £100 billion higher than that which the government is forecasting as illustrated by the annual budget deficits forecast graph below-
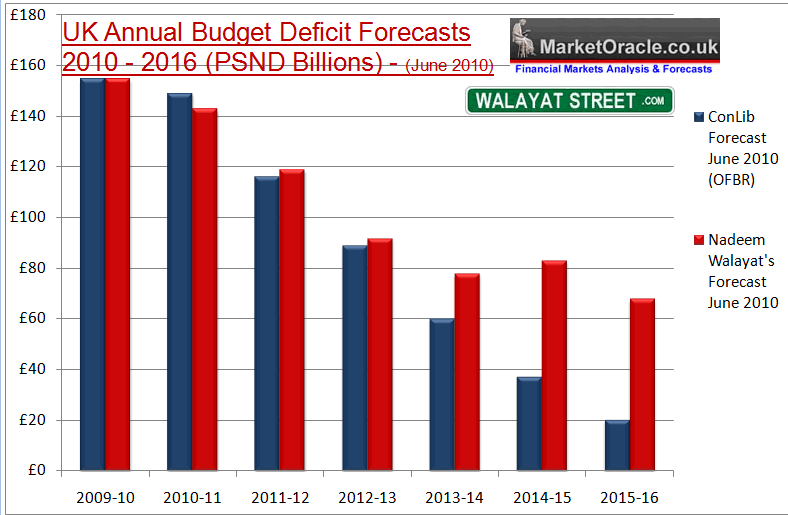
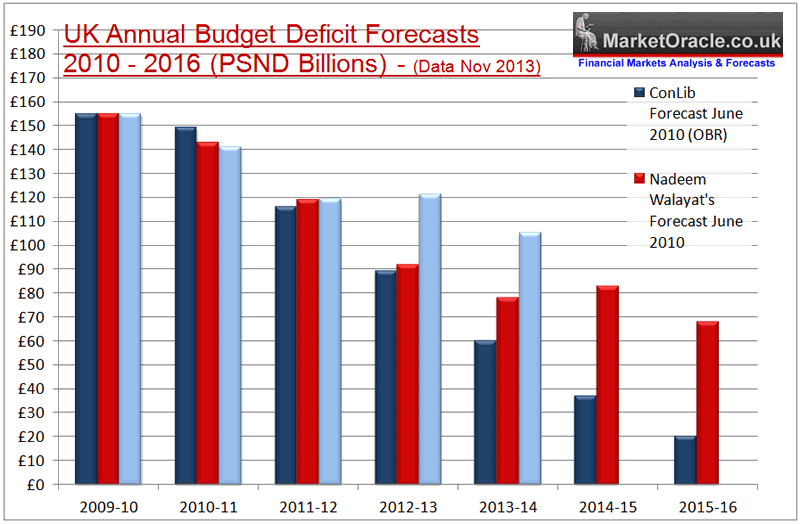
Whilst the ConLib's deficit reduction targets represent an improvement under the Labour governments target that would have resulted in extra borrowing of £478 billion over the next 4 years if the Labour government managed to stick to its targets. However the ConLib government will still expand total debt by £414 billion over the next 4 years, and £471 billion over the next 6 years to reach £1,242 billion, so hardly an earth shattering improvement.
The following updated graph for UK public sector net debt clearly shows that the Coalition government is on a trajectory for total additional debt of £130 billion bringing the total debt printed to over £500 billion. I say printed rather than borrowed because the Bank of England has been busy printing money and BUYING government bonds (debt) then returning most of the interest paid on some £400 billion of QE debt back to the UK Treasury.
The only differences between Labour and the Conservatives is the amount of debt they will print i.e. Labour is far more predisposed to printing debt to funnel towards unproductive sectors of the economy such as the public sector and the estimated 5 million of lard asses permanently sat on benefits for life who as vested interests will vote Labour, so a Labour government would probably have resulted in at least an extra £200 billion of debt printed with associated higher inflation.
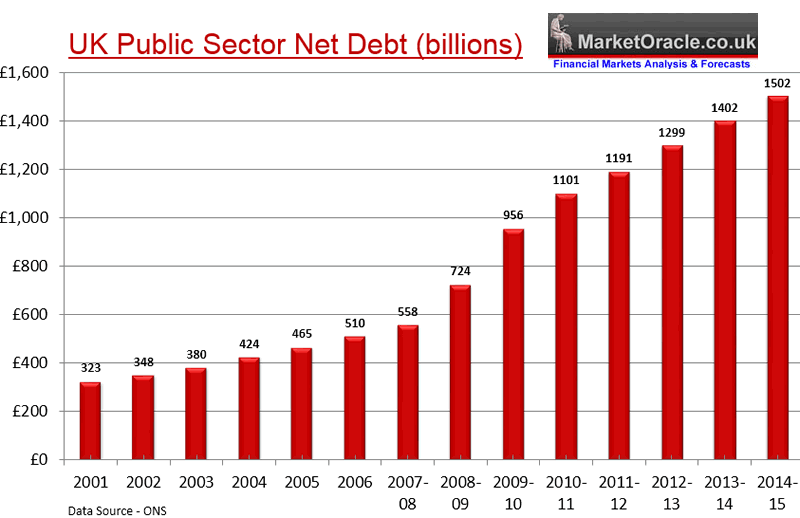
This illustrates the reason for the real inflation truth that is far removed from that which the media focuses upon with the annual percentage rates of inflation that masks the truth of what is an exponential inflation mega-trend which is the primary consequences of perpetual money and debt printing monetization programmes that the government is engaged in, in an attempt to buy votes through high deficit spending, an inflation trend that asset prices are leveraged to and oscillate around to what amounts to an exponential trend.
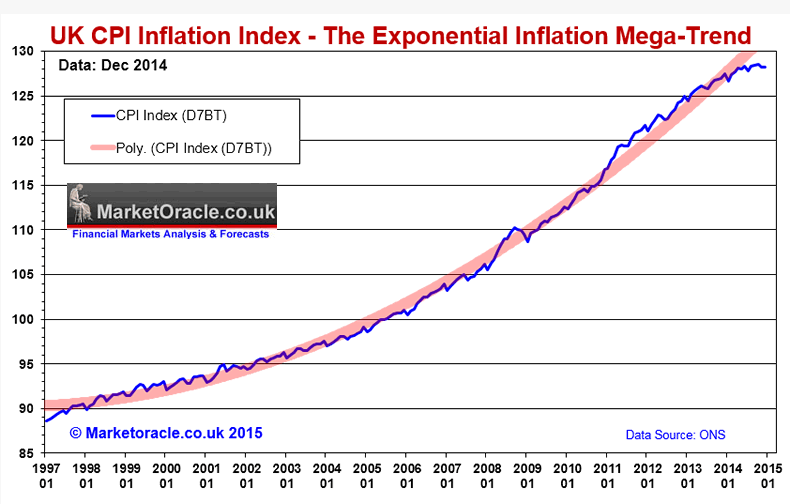
The bottom line is that the Inflation mega-trend is exponential and the politicians, central banks and their vested interest academics deflation fears amount to nothing more than propaganda so as to allow governments to print debt (money) to buy votes with during an election year which means a year from now CPI Inflation will back above the 2% target, and probably nudging past 3%!
In terms of low inflation implications for the outcome of the UK General Election ensure you are subscribed to my always free newsletter from my next in-depth analysis and detailed forecast in your email box.
In the meantime see my existing long standing forecast conclusion as of December 2013.
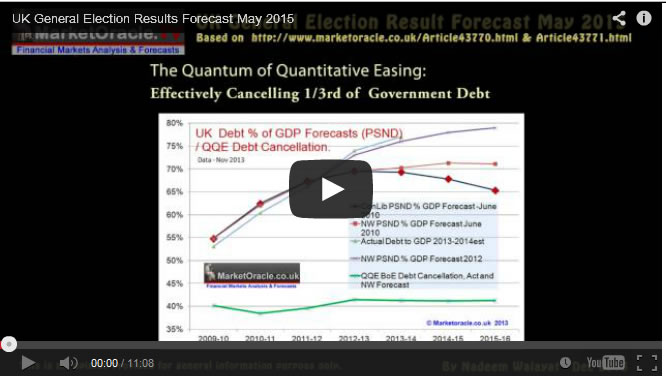
16 Dec 2013 - UK General Election Forecast 2015, Who Will Win, Coalition, Conservative or Labour?
The following graph attempts to fine tune the outcome of the next general election by utilising the more conservative current house prices momentum of 8.5% which has many implications for strategies that political parties may be entertaining to skew the election results in their favour.
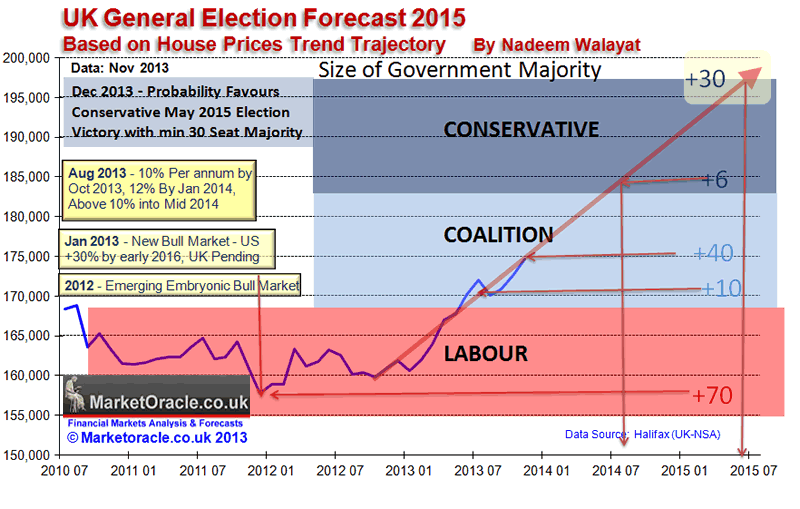
The the key implications of the above graph are -
- The window for an outright labour election victory has ended as of July 2013.
- As of writing an election today would result in a Coalition government with a majority of about 40 seats.
- The window of opportunity for a Coalition government ends by mid 2014 after which there is an increasing probability for a Conservative outright majority.
- A May 2015 general election at an average house price inflation rate of 8.5% would result in a Conservative overall majority of about 30 seats. Therefore this is my minimum expectation as I expect UK house prices to start to average 10% per annum from the beginning of 2014.
And also a video version of the analysis and forecast conclusion -
Source and Comments: http://www.marketoracle.co.uk/Article49488.html
By Nadeem Walayat
Copyright © 2005-2015 Marketoracle.co.uk (Market Oracle Ltd). All rights reserved.
Nadeem Walayat has over 25 years experience of trading derivatives, portfolio management and analysing the financial markets, including one of few who both anticipated and Beat the 1987 Crash. Nadeem's forward looking analysis focuses on UK inflation, economy, interest rates and housing market. He is the author of five ebook's in the The Inflation Mega-Trend and Stocks Stealth Bull Market series that can be downloaded for Free.
 Nadeem is the Editor of The Market Oracle, a FREE Daily Financial Markets Analysis & Forecasting online publication that presents in-depth analysis from over 1000 experienced analysts on a range of views of the probable direction of the financial markets, thus enabling our readers to arrive at an informed opinion on future market direction. http://www.marketoracle.co.uk
Disclaimer: The above is a matter of opinion provided for general information purposes only and is not intended as investment advice. Information and analysis above are derived from sources and utilising methods believed to be reliable, but we cannot accept responsibility for any trading losses you may incur as a result of this analysis. Individuals should consult with their personal financial advisors before engaging in any trading activities.
Nadeem Walayat Archive |
© 2005-2022 http://www.MarketOracle.co.uk - The Market Oracle is a FREE Daily Financial Markets Analysis & Forecasting online publication.


