


Stock Markets End of the 1-year Sideways Trend
Stock-Markets / Stock Markets 2015 Feb 11, 2015 - 03:28 AM GMTBy: Clif_Droke

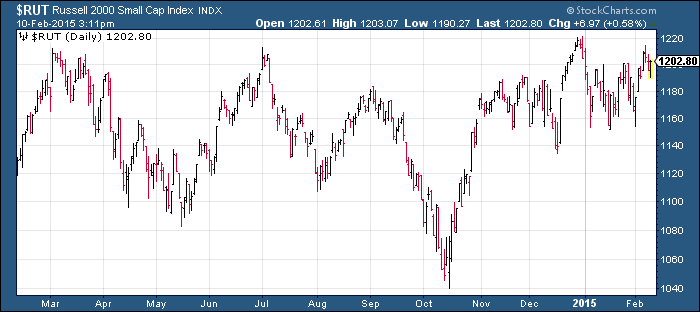
 Investors are starting to feel numb by the lack of action in the broad market. Since December, the Dow and SPX have settled into sideways trading ranges. The NYSE Composite (NYA) has been range-bound since last summer while the Russell 2000 (RUT) has been stuck in a lateral ranges for the past year. While trading ranges don't necessarily result in the loss of capital, its effect on the minds of market participants tend to be significant. Trading ranges are frustrating. When trading ranges become established over a period of months the effects upon investor and mass psychology can even be devastating.
Consider that some of the most devastating social, political and military revolutions in history have occurred during prolonged periods of stagnation in both the economy and the equity market of the countries concerned. Human nature is dynamic and demands continual movement - whether in the form of progress or even regress. A long period of stagnation where neither progress nor regress is seen has a profound impact on the human psyche in the aggregate and can lead to psychosis if the stagnation continues for very long.
There is also the effect of the trading range to consider upon the mind of the individual. The celebrated stock trader Jessie Livermore is a case in point. After making a fortune selling short the stock market prior to the 1929 crash, he found himself at the mercy of the dull market conditions of the late 1930s and early 1940s and was unable to make his accustomed living from the market. He ended his life by blowing his brains out in a hotel coat closet in 1940.
Trading ranges also tend to be characterized by increased volatility. It's easy to be fooled by the periods of increasing market volatility during the times when stocks are visiting the lower end of the trading range. Many (falsely) assume that the volatility spikes mean that the market is primed for a bear market. But periodic volatility spikes are part and parcel of any drawn out sideways movement in the major indices and nothing can be inferred by the temporary rallies in the Volatility Index.
It's certainly understandable that investors, particularly small-cap investors, are feeling frustrated right now. After all, they've had to sit through more than a year of seeing their portfolios going virtually nowhere, if the Russell 2000 chart is any indication. It's no wonder that active participation among retail traders has dwindled in the last several months.
Trading ranges serve a distinctive purpose, however, and they tend to be beneficial for the longer-term health of the stock market. Sideways trading ranges can either represent distribution (i.e. informed selling) or else accumulation (buying). More often than not, they represent a period of consolidation for a bull market that has over-exerted itself and needs rest. Lateral trading ranges typically serve as an intermission before the next phase of the bull market. As a rule, the longer the duration of the range, the more powerful the subsequent rally tends to be.
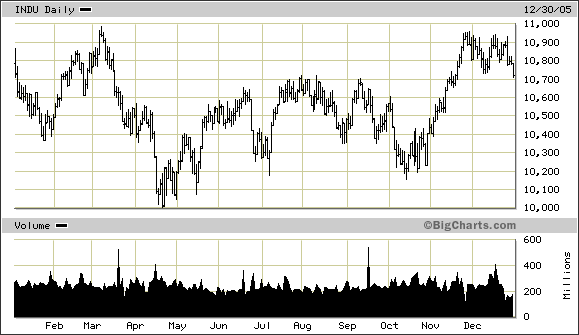
A good example of a trading range year which gave way to a solid breakout performance for stocks occurred 10 years ago. Below is a chart of the Dow 30 index. Note the overall lateral trading pattern for much of that year.
Here is how the Dow resolved that range in 2006.
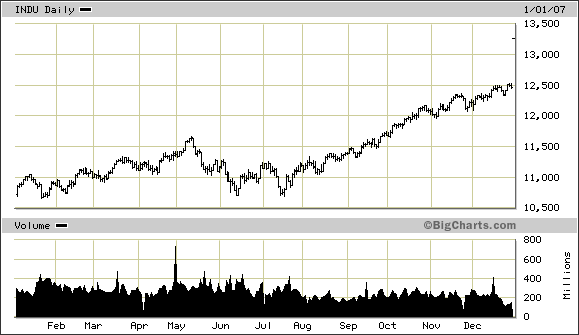
This is not to say that stocks will spend most of 2015 in a sideways trading range. As we talked about in the 2015 forecast edition, there are several likely inflection points this year for tradable trends - possibly lasting 2-3 months at a time. Another point worth mentioning: unlike in 2005, the longer-term yearly cycles are up, not down.
This brings us to the ultimate question: when will the current trading range period for the stock market finally end? That question is very much an open one for which the market hasn't yet provided an answer. However, the indicators suggest that a breakout attempt above the trading range ceiling will likely be made in this quarter. Moreover, the odds strongly favor of an upside resolution to the lateral trading range by mid-year by virtue of this being: a.) an up year in the alternate 2-year cycle; b.) a Year Five Phenomenon year; and c.) a year when the Kress yearly cycles all kick in to the upside.
Mastering Moving Averages
The moving average is one of the most versatile of all trading tools and should be a part of every investor's arsenal. The moving average is one of the most versatile of all trading tools and should be a part of every investor's arsenal. Far more than a simple trend line, it's a dynamic momentum indicator as well as a means of identifying support and resistance across variable time frames. It can also be used in place of an overbought/oversold oscillator when used in relationship to the price of the stock or ETF you're trading in.
In my latest book, "Mastering Moving Averages," I remove the mystique behind stock and ETF trading and reveal a completely simple and reliable system that allows retail traders to profit from both up and down moves in the market. The trading techniques discussed in the book have been carefully calibrated to match today's fast-moving and sometimes volatile market environment. If you're interested in moving average trading techniques, you'll want to read this book.
Order today and receive an autographed copy along with a copy of the book, "The Best Strategies For Momentum Traders." Your order also includes a FREE 1-month trial subscription to the Momentum Strategies Report newsletter: http://www.clifdroke.com/books/masteringma.html
By Clif Droke
www.clifdroke.com
Clif Droke is the editor of the daily Gold & Silver Stock Report. Published daily since 2002, the report provides forecasts and analysis of the leading gold, silver, uranium and energy stocks from a short-term technical standpoint. He is also the author of numerous books, including 'How to Read Chart Patterns for Greater Profits.' For more information visit www.clifdroke.com
Clif Droke Archive |
© 2005-2022 http://www.MarketOracle.co.uk - The Market Oracle is a FREE Daily Financial Markets Analysis & Forecasting online publication.