


Stocks Bull Market Resuming?
Stock-Markets / Stock Markets 2015 Feb 07, 2015 - 04:57 PM GMTBy: Michael_Noonan

 February kicks off with a strong week. The market started the week at SPX 1995. Despite a gap up opening on Monday the market quickly dropped to SPX 1981 in the first half hour of trading. That was the low for the week. After a choppy beginning off that low, the market rallied to SPX 2072 by Friday with only two sizeable pullbacks along the way. Then, late afternoon Friday, it had its biggest pullback since that low. For the week the SPX/DOW gained 3.40%, the NDX/NAZ gained 2.15%, and the DJ World index gained 2.30%. On the economic front negative reports outpaced positive reports. On the uptick: personal income, construction spending, consumer credit, auto sales, ISM services, monthly payrolls and the WLEI. On the downtick: personal spending, ISM manufacturing, factory orders, the ADP, the MMIS, the monetary base, plus weekly jobless claims and the trade deficit increased. Next week’s reports are highlighted by Retail sales, Export/Import prices and Business inventories.
LONG TERM: bull market
We continue to label this market as a Cycle [1] five Primary wave bull market. Primary waves I and II completed in 2011, and Primary wave III appears to be still underway. Primary I divided into five Major waves with a subdividing Major 1, and simple Major waves 3 and 5. Primary III appears to be following an alternate path. Thus far it has a simple Major wave 1, and a very extended/subdividing Major wave 3. Should our count be correct: Major wave 3 completed in early-December, Major wave 4 may have just completed in early-February, and a potential subdividing Major wave 5 has just begun.
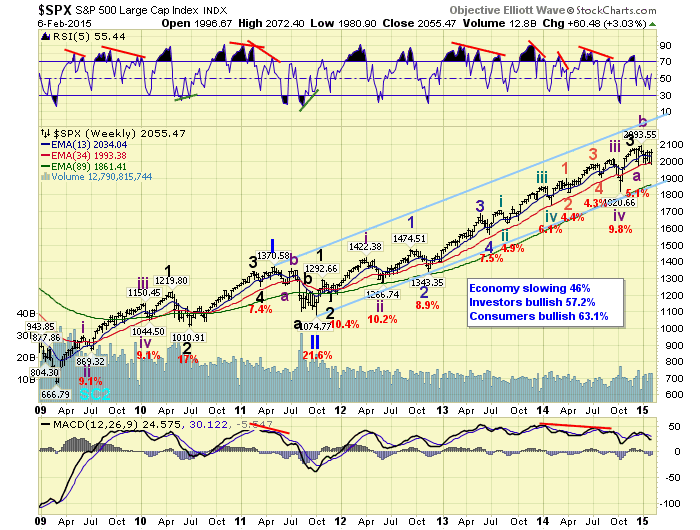
We had noted last week that our long term indicators were not displaying any signs of a Primary III high as of yet. But we have been offering that 20% probability count on the DOW charts. Should Primary III continue to extend, a 70% probability, we could see it continue until mid-2016. Then a quite steep Primary IV should follow, before the market launches Primary V to new highs some time in 2017. This is the potential scenario we have been considering since the fall of 2014. However, we are still awaiting new all time highs in 2015 before making any price projections going forward.
MEDIUM TERM: uptrend
After hitting an all time high in late-December, the market went into a choppy sideways correction in January. Since that uptrend did not take much more than just one week, and the NDX failed to confirm an uptrend, we labeled that high an Int. wave b of a larger Major wave 4 correction. This suggests the SPX 2079 high in early-December would be considered the Major wave 3 high. Then the SPX 1973 low in mid-December Int. wave a, the SPX 2094 high in late-December Int. b, and the recent SPX 1981 low Int. wave c.
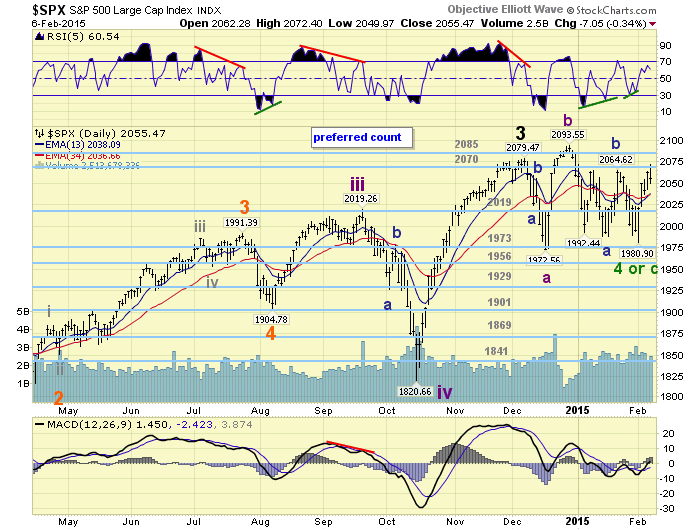
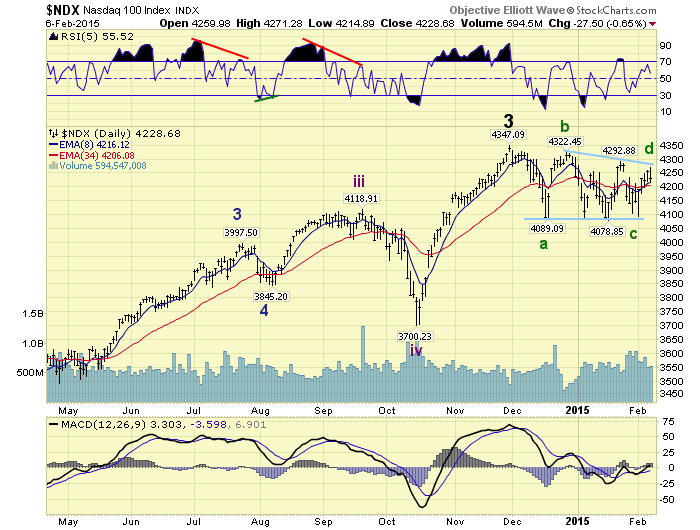
This count would suggest Major wave 4 ended with an irregular failed flat in the SPX/NAZ, and just an irregular flat in the DOW/NDX since they both made lower lows. Under this scenario the rally that started this week would be the beginning of Major wave 5. There is also another possibility. Major wave 4 could be forming a triangle. Under this scenario the waves remain the same, but the current rally is Int. wave d, and the market should soon decline to complete Int. wave e ending the triangle around SPX 2000. This is illustrated below in the NDX chart.
Fortunately we can put some probabilities on these two scenarios as well. This week the market generated a WROC signal. This signal usually precedes an uptrend confirmation. Over the past 50+ years its success rate has been 96%. While we are still awaiting the uptrend confirmation we can also place a probability on whether or not it will be a D wave. Historically this has only occurred 11% of the time. Therefore the WROC suggests the market has a 96% probability of being in an uptrend, and the uptrend only has an 11% probability of being a D wave of a triangular Major wave 4. Medium term support is at the 2019 and 1973 pivots, with resistance at the 2070 and 2085 pivots.
SHORT TERM
If we go with the most probable count: Major wave 4 ended in an irregular failed complex flat at SPX 1981 on Monday. We can then start to track this potential uptrend as a impulse wave starting, probably, Int. wave i of Major wave 5. The first thing we were looking for this week was a five wave advance off the low. This would suggest the market is impulsing rather than just rallying in a corrective wave. We did observe five waves up from SPX 1981: 2010-1991-2040-2028-2050.
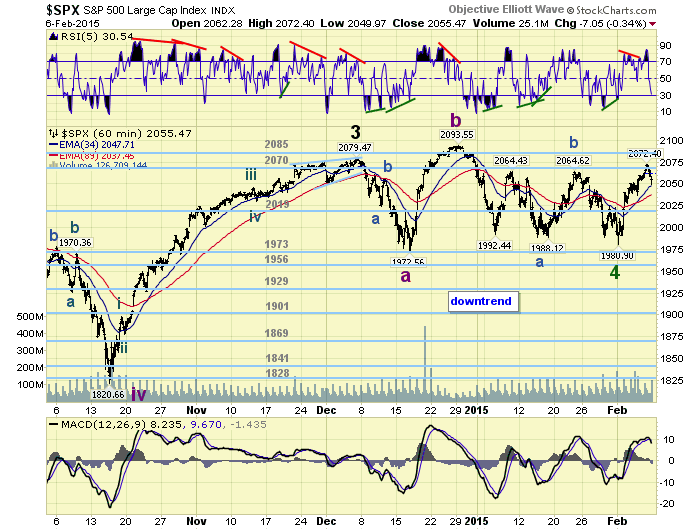
The next thing we were looking for, on a larger time frame, is of course five waves again. Thus far we have seen four waves: 2010-1991-2072-2050. To get the fifth wave the should now rally to SPX 2072 or higher, and then have a larger pullback. Should this occur we would label it Minor wave 1 of an Intermediate wave i uptrend. This would also fit with the hourly chart posted above. Should the market fail to reach, or exceed, SPX 2072 during the next rally, then it may still be a wave d despite the probabilities. However, the probabilities do favor an impulsive uptrend underway with new all time highs soon. Short term support is at SPX 2037 and SPX 2028, with resistance at the 2070 and 2085 pivots. Short term momentum ended the week oversold after hitting extremely overbought on Friday.
FOREIGN MARKETS
Asian markets were quite mixed on the week for a gain of 0.2%.
European markets continued to advance gaining 2.9% on the week.
The Commodity equity group were all higher and soared 6.4% on the week.
The DJ World index gained 2.3% and is in an uptrend.
COMMODITIES
Bonds have been in an uptrend, but that might have ended as they declined 2.0% this week.
Crude has been in a downtrend, but this week’s surge of 8.0% suggests an uptrend may be underway.
Gold also appears to be in a transition, (uptrend to downtrend?) as it lost 3.8% on the week.
The USD continues to uptrend despite losing 0.2% on the week.
NEXT WEEK
Monday: speech from FED governor Powell at 4pm. Tuesday: Wholesale inventories and Senate testimony from FED director Hunter. Wednesday: the Budget deficit. Thursday: weekly Jobless claims, Retail sales and Business inventories. Friday: Export/Import prices and Consumer sentiment.
CHARTS: http://stockcharts.com/public/1269446/tenpp
http://caldaroew.spaces.live.com
After about 40 years of investing in the markets one learns that the markets are constantly changing, not only in price, but in what drives the markets. In the 1960s, the Nifty Fifty were the leaders of the stock market. In the 1970s, stock selection using Technical Analysis was important, as the market stayed with a trading range for the entire decade. In the 1980s, the market finally broke out of it doldrums, as the DOW broke through 1100 in 1982, and launched the greatest bull market on record.
Sharing is an important aspect of a life. Over 100 people have joined our group, from all walks of life, covering twenty three countries across the globe. It's been the most fun I have ever had in the market. Sharing uncommon knowledge, with investors. In hope of aiding them in finding their financial independence.
Copyright © 2015 Tony Caldaro - All Rights Reserved Disclaimer: The above is a matter of opinion provided for general information purposes only and is not intended as investment advice. Information and analysis above are derived from sources and utilising methods believed to be reliable, but we cannot accept responsibility for any losses you may incur as a result of this analysis. Individuals should consult with their personal financial advisors.
Tony Caldaro Archive |
© 2005-2022 http://www.MarketOracle.co.uk - The Market Oracle is a FREE Daily Financial Markets Analysis & Forecasting online publication.