


The Secret to Successful Trading - Using Rules to Time Your Entry
InvestorEducation / Learn to Trade Mar 10, 2007 - 01:55 AM GMTBy: Hans_Wagner

When learning how to invest in the stock market, one of the most important lessons is to entry the stock at the right price. Getting the entry right will go a long way to help you beat the stock market .
Many investors believe that learning to read and interrupt a chart will lead to profitable trading. Unfortunately, this isn't true. Good technical analysis is important to trading and can be learned. However, it becomes much more difficult when you are trading with real money and the emotional commitment that real-life trading creates. The key to success is using well defined rules to time your entry.
There are many ways to time an investor's entry into a stock, though there are three strategies that work best for value investors and swing traders. First, enter a breakout through resistance, or a breakdown through support. Second, wait for a pull back to support (if going long) or to resistance (if going short). Third, buy or sell within a trading range before the move begins.
Deciding which strategy is the best depends on a variety of factors including the current market trends, the risk-reward ratio, the chosen holding period, and the trading volume.
Support and Resistance
Before discussing these three strategies it is important to understand support and resistance. Support is the point where enough buyers come into a market to impede a drop in price. It is the price level at which demand is strong enough to prevent the price from declining further. Logic dictates that as the price declines towards support and gets cheaper, buyers become more inclined to buy and sellers become less inclined to sell. By the time the price reaches the support level, the theory states that demand will overcome supply and prevent the price from falling below support.
Conversely, resistance is where enough sellers enter a market that the price stops rising. It is the price level at which selling is thought to be strong enough to prevent the price from rising further. Logic dictates that as the price advances towards resistance, sellers become more inclined to sell and buyers become less inclined to buy. By the time the price reaches resistance, the theory states that supply will overcome demand and prevent the price from rising further.
Identifying Breakouts and Pull Back Entry Points
A breakout through resistance is one of the most common ways technicians use to enter a stock. A breakout is when the price rises through a resistance level. The logic is that buying volume is greater than selling volume, so the price rises through the resistance level. The key on breakouts is that volume is sufficiently strong to overcome the selling pressure that usually exists at resistance levels. Without sufficient volume, it is usually not a good idea to buy a breakout, as the price will likely pull back.
For example, notice on the chart below that CRZO broke out through prior resistance levels at the 10.5 area and the 10.87 area. Then notice that the volume was above average, though only slightly. I like to see very strong volume on breakouts, at least 130% of the daily average, though the more the better. This is where the strong volume calculator comes in handy. It helps predict the daily volume and percent part way through the day. If the volume is sufficiently above average on a breakout, then that is a good buying indicator. If not, then it is usually best to wait. On the chart below the volume was not sufficiently above average, so it would be best to hold off on buying.
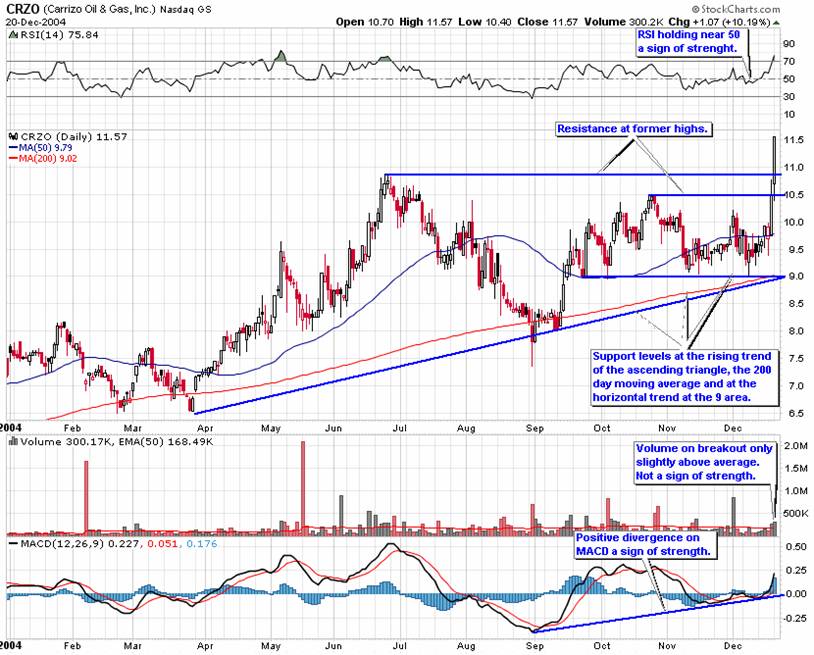
During the next several weeks CRZO pulled back to the prior resistance levels. This validated the decision to not take a position in CRZO on the initial breakout. Also, notice that RSI stayed at or above the 50 area, a good sign and the MACD indicator remained in a positive divergence. These indicators help to confirm the overall trend is still up. An entry in late December 2004 would have been OK as there was support below at the next prior high and the 50 day moving average. However, it was the last week of the year and trading during this time period is usually suspect as most professionals are on vacation. Waiting for the New Year to begin is a better idea.
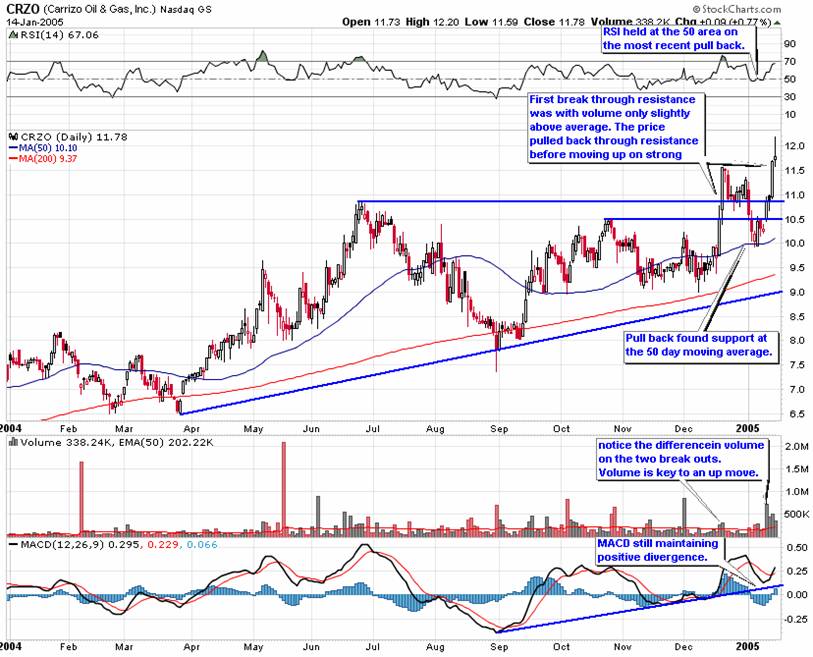
When the price bounced off of the 50 moving average, is was a sign that we might be able to make a pull back entry. The break through prior resistance level of 10.5 with volume was a very positive sign to take an initial position. Here we have a good example of a breakout with so-so volume, a pull back to support and then a new move up. This is usually a good time to buy as your risk reward trade off is favorable.
Breakout Rules
- Trade with the overall market trend.
- Trade with the sector trend. This usually means that the sector is fundamentally strong and is expected to be a positive influence on the market for months to come.
- Find stock patterns that provide good support and resistance levels.
- Check to see that your indicators support the trend of the breakout. If using RSI it should be moving up through or above 50; MACD should show positive divergence.
- Identify exit target and stop levels. While not a way to identify breakouts it is an essential part of the entry strategy if investors expect to be successful.
- On breaks through resistance, buy when volume is sufficiently strong as determined by the strong volume calculator.
- Use limit orders where the price is likely to be executed. Good day traders often set the limit price at 0.05 to 0.10 above the resistance level and issue the order just as the price penetrates resistance.
- Once your trade is executed, set your trailing stop and target prices. Use mental stops if you have the mental discipline and are able to monitor the market. Otherwise establish these stop orders with your broker.
Pull Back Rules
- Trade with the overall market trend.
- Trade with the sector trend. This usually means that the sector is fundamentally strong and is expected to be a positive influence on the market for months to come.
- Find stock patterns that provide good support and resistance levels.
- Check to see that your indicators support the trend of the breakout. If using RSI it should be moving up through or above 50; MACD should show positive divergence.
- Identify exit target and stop levels. While not a way to identify pull backs it is an essential part of the entry strategy if investors expect to be successful.
- After a break through resistance on low or less than strong volume, look for signs that the support levels are holding. Also, look for other reasons the stock should move including fundamentals, the calendar, etc.
- Pullbacks that bounce off of support levels are good ways to enter a stock that shows good fundamental and positive technical signs. They usually have less risk as you are entering closer to key support levels.
- Buy after the move up from support as this usually indicates support is holding. Generally, do not try to pick the exact bottom as the support level may not hold.
- Use limit orders where the price is likely to be executed.
- Once your trade is executed, set your trailing stop and target prices. Use mental stops if you have the psychological discipline to stick with the stop and are able to monitor the market. Otherwise establish these orders with your broker.
Conclusion
Timing the entry is one of the most important techniques for profitable investing. When combined with good fundamental analysis that finds good companies at discounted prices, it can provide investors with optimal entry levels. Breakouts and Pull Backs to support are two of the best methods to time your entry into a good stock. As shown above the pull back to support often follows a breakout. As a result the blending of these two patterns can be used together to reinforce the timing of your entry. The next point of interest will primarily deal with the third entry strategy, buy or sell within a trading range before the move begins.
By Hans Wagner
tradingonlinemarkets.com
My Name is Hans Wagner and as a long time investor, I was fortunate to retire at 55. I believe you can employ simple investment principles to find and evaluate companies before committing one's hard earned money. Recently, after my children and their friends graduated from college, I found my self helping them to learn about the stock market and investing in stocks. As a result I created a website that provides a growing set of information on many investing topics along with sample portfolios that consistently beat the market at http://www.tradingonlinemarkets.com/
© 2005-2022 http://www.MarketOracle.co.uk - The Market Oracle is a FREE Daily Financial Markets Analysis & Forecasting online publication.