


Euro Time For Recovery
Currencies / Euro Feb 04, 2015 - 10:20 AM GMTBy: Nadia_Simmons

 Earlier today, the U.S. Census Bureau showed that factory orders dropped by 3.4% in December, missing expectations for a decline of 2.2%. Thanks to these numbers, EUR/USD moved sharply higher, breaking above important resistance levels. Will we see a comeback above 1.1600 in the coming days?
In our opinion, the following forex trading positions are justified - summary:
EUR/USD: Long (stop loss order at 1.1310)
GBP/USD: none
USD/JPY: none
USD/CAD: Short (stop loss order at 1.2645)
USD/CHF: none
AUD/USD: none
EUR/USD
The medium-term picture hasn't changed much as and invalidation of the breakdown below the 61.8% Fibonacci retracement and its positive impact on the exchange rate are still in effect. Having said that, let's focus on the daily chart.
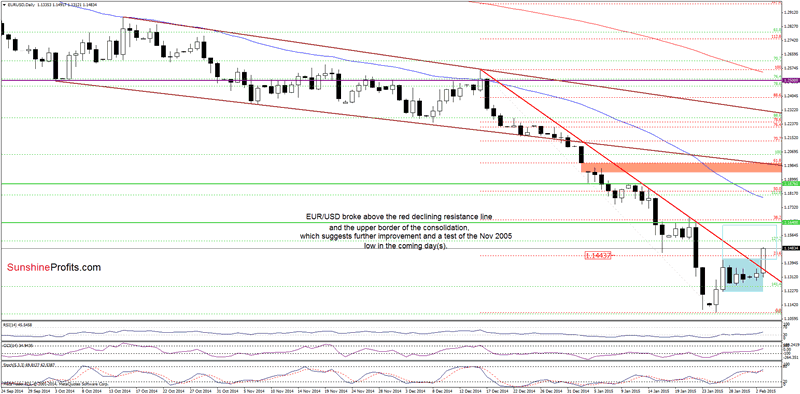
The first (and the most important) thing that caches the eye on the above chart is a breakout above the red declining resistance line, the 23.6% Fibonacci retracement and the upper line of the consolidation (marked with blue). These are bullish signals that suggest further improvement and an increase to at least the next resistance zone created by the Jan 22 high and the previously-broken Nov 2005 low.
Very short-term outlook: bullish
Short-term outlook: mixed
MT outlook: mixed
LT outlook: mixed
Trading position (short-term): Long positions with a stop loss order at 1.1310 are justified from the risk/reward perspective at the moment. However, taking into account the proximity to the resistance area, we'll likely take profits in the coming days.
USD/CAD
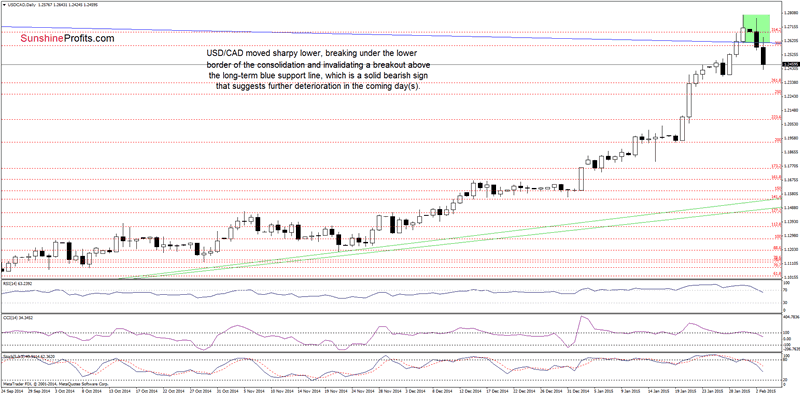
From today's point of view, we see that USD/CAD dropped below the lower border of the consolidation (marked with green on the daily hart) and the long-term blue support line, invalidating earlier breakout. On top of that, all indicators generated sell signals, supporting the bearish case. These are negative signals, which suggest further deterioration. How low could the exchange rate go? The initial downside target will be around 1.2379, where the bottom of the previous correction is. What if this level is broken? Let's take a closer look at the weekly hart and find out.
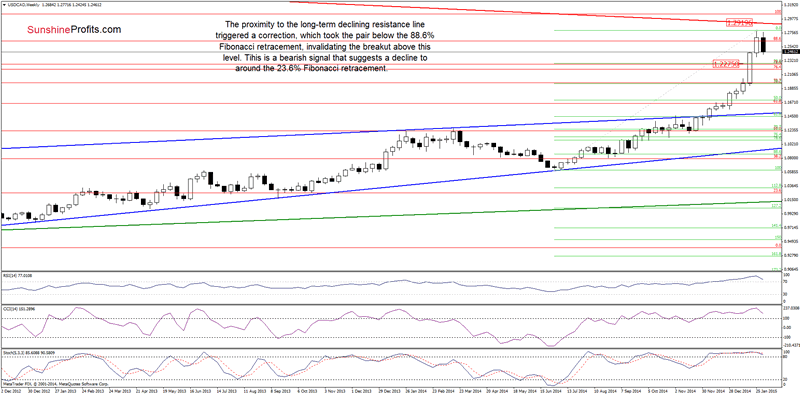
Looking at the above chart, we see that the recent downswing took the pair below the 88.6% Fibonacci retracement, invalidating earlier breakout above this level. This is an additional bearish signal that suggests a drop to the 23.6% (around 1.2275) or even 38.2% (at 1.1973) Fibonacci retracement based on the entire Jun-Jan rally in the coming week.
Very short-term outlook: bearish
Short-term outlook: mixed
MT outlook: mixed
LT outlook: mixed
Trading position (short-term; our opinion): Short positions with a stop loss order at 1.2645 are justified from the risk/reward perspective at the moment. However, taking into account the proximity to the support area, we'll likely take profits in the coming days.
USD/CHF
The situation in the medium-term has't changed much as the exchange rate still remains above the Mar 2014 lows.
What can we infer from the daily chart? Let's find out.
Quoting our Forex Trading Alert posted on Friday:
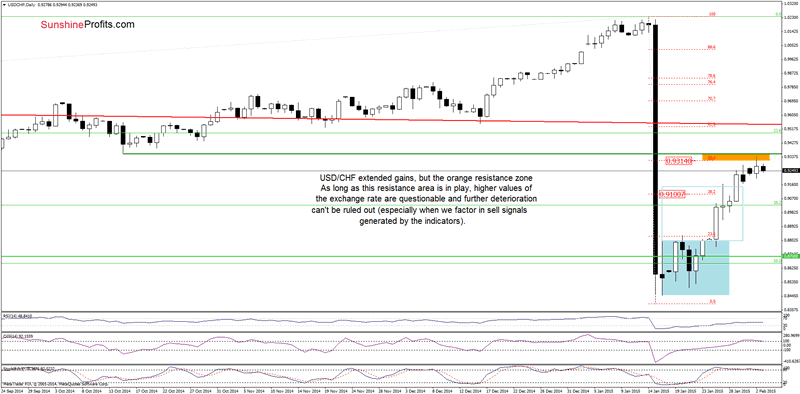
(...) the pair is still trading around yesterday's high and above the previously-broken 38.2% Fibonacci retracement, which suggests that another attempt to move higher is likely.
As you see on the daily chart, the situation developed in line with the above-mentioned scenario and the exchange rate climbed to the orange resistance zone (created by the 50% Fibonacci retracement and the Oct 2014 low). Earlier today, this area triggered a pullback, but USD/CHF is still trading between yesterday's high and low. What's next? In our opinion, as long as there is no breakout above these levels, higher values of the exchange rate are questionable and further deterioration can't be ruled out - especially when we factor in sell signals generated b the indicators.
Very short-term outlook: mixed with bearish bias
Short-term outlook: mixed
MT outlook: mixed
LT outlook: bearish
Trading position (short-term; our opinion): No positions are justified from the risk/reward perspective at the moment.
Thank you.
Nadia Simmons
Sunshine Profits‘ Contributing Author
Oil Investment Updates
Oil Trading Alerts
* * * * *
Disclaimer
All essays, research and information found above represent analyses and opinions of Nadia Simmons and Sunshine Profits' associates only. As such, it may prove wrong and be a subject to change without notice. Opinions and analyses were based on data available to authors of respective essays at the time of writing. Although the information provided above is based on careful research and sources that are believed to be accurate, Nadia Simmons and his associates do not guarantee the accuracy or thoroughness of the data or information reported. The opinions published above are neither an offer nor a recommendation to purchase or sell any securities. Nadia Simmons is not a Registered Securities Advisor. By reading Nadia Simmons’ reports you fully agree that he will not be held responsible or liable for any decisions you make regarding any information provided in these reports. Investing, trading and speculation in any financial markets may involve high risk of loss. Nadia Simmons, Sunshine Profits' employees and affiliates as well as members of their families may have a short or long position in any securities, including those mentioned in any of the reports or essays, and may make additional purchases and/or sales of those securities without notice.
© 2005-2022 http://www.MarketOracle.co.uk - The Market Oracle is a FREE Daily Financial Markets Analysis & Forecasting online publication.