Unwinding the Yen carry Trade and its Effect on the Financial Markets
Stock-Markets / Yen Carry Trade Mar 10, 2007 - 01:47 AM GMTBy: Adam_Oliensis
Two weeks ago I wrote:
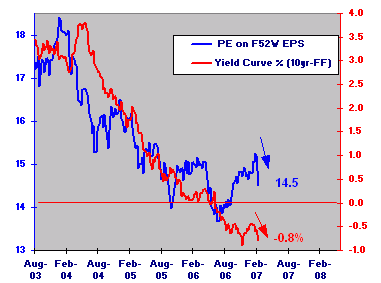
I suspect that in the context of an inverted yield curve (and especially of a steepening inversion) the market's PE is unlikely to continue to expand as it has since last summer. Note that since '03 there has been a strong correlation between the sinking market PE and the flattening (and then inverting) yield curve. At present PE is rising as the trend in the yield curve resists doing likewise. I continue to suspect that that divergence is unsustainable.
The above was written in reference to the following chart when the market PE (blue line) was peaking at 15.2. It has since sunk (abruptly) to 14.5.
I further elaborated:
Unless the bond market starts discounting accelerating economic growth I suspect that the "cap" on PE will be not too far above where it is now.
The temptation exists to poo-poo the inversion of the Yield Curve as "different this time." But at some point in the not-too-distant future bond and stock investors are probably going to have to come to some sort of closer agreement about what the prospects indeed are for the economy. A condition in which the bond market is discounting +2.36% real GDP and in which the stock market is discounting earnings growth that's a 3.3 times greater…well, that's very likely unsustainable.
The time is right for the market to "take stock" of these factors.
Lest you think that my main interest is in patting myself on the back for being reasonably timely with the warning, while I was cautious I did NOT anticipate an adjustment as swift and severe as the one that the equity markets (and indeed virtually all financial markets) underwent last week.
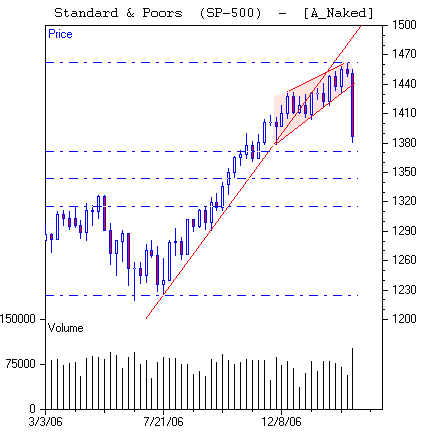
Last week we looked at this weekly chart of the SPX (since updated with last week's long red candle):
And I wrote:
The (pink) wedge is a potentially bearish formation as the shallower slope of the upper limit of the wedge represents diminished buying enthusiasm at higher levels. And if the wedge breaks to the downside, especially after a multi-month advance such as the one that has been enjoyed since July, then profit-taking can become compelling motivation for selling.
But, honestly, I did not think that we would set about retracing almost 38% of the market's July-February advance in a week's time.
So, what's going on? Well, for one thing, (and this may be the primary catalyst of the wicked sell-down), it appears that some comments by a Japanese finance minister about the size of the Yen Carry Trade helped to trigger a panicky buying spree in the Japanese Yen. Which is to say, that the huge preponderance of borrowing in Yen (engendered by near-zero Japanese interest rates) to finance purchases of virtually all other sorts assets, of both the hard and paper varieties, began to unwind but fast.
This next chart plots the March futures in the SPX, the Japanese Yen, and the US Dollar.
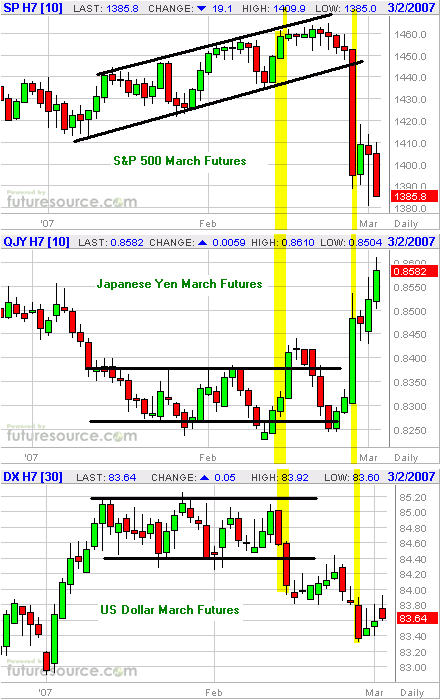
As you can see, the past week's action is defined by an inverse correlation between the S&P Futures and the Yen; the S&P tanking while the Yen surged. While the declining Dollar does seem to be involved, it appears that the upsurge of the Yen is much more aggressively germane than the Dollar's decline. And that interpretation is borne out by the nasty decline in the Gold market as well. It's the panic to pay back borrowed/leveraged Yen for fear of that currency's further appreciation that has pushed all the financial markets lower. (If the primary factor were the dollar's decline, then Gold would likely be rising, not falling in Dollar terms.)
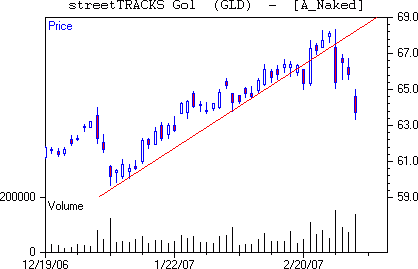
GLD, the ETF that tracks the price of Gold at 1/10 the price, declined 7.3% from Tuesday through Friday, from $68.33 to $63.34. Remarkably, investors were even selling Gold to buy Yen.
This global fear of the unwinding of the Yen Carry Trade (the borrowing of Yen to buy everything else) has caused the bond market to price in further-decelerating US economic growth.
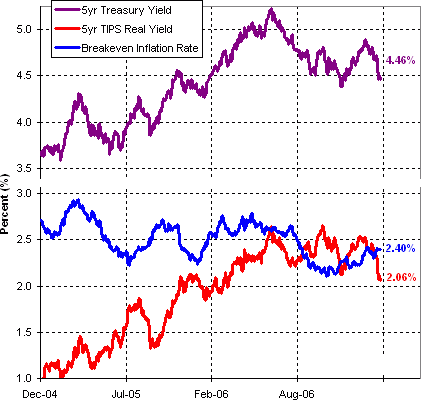
The flight to quality pushed the yield on the 5-Yr Treasury down to 4.46% (the 10-Yr is just a bit higher at 4.51%).
The TIPS market is now discounting economic growth at something very close to 2% over the coming 5 years, down from 2.6% last autumn. And that fear of further-decelerating growth has raised our Equity Risk Premium (ERP, defined as the SPX's Forward Earnings Yield less the 10-Yr Treasury Yield -- 6.89% - 4.51% = 2.38%) up to a heightened level.
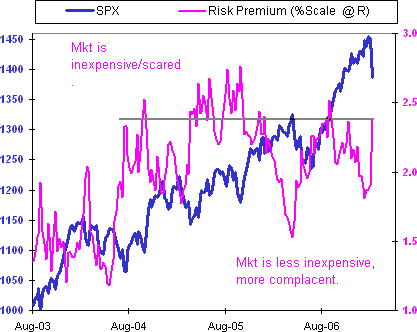
The long-term average ERP is near 0%. However, the median post-9/11 ERP is about 1.98%. So, while it is possible that ERP will get pushed higher, it is already at an extremely elevated level, in about the 87th percentile of all ERP readings since 1960.
That said, unless inflation is in double digits, it is extremely difficult to begin a bear market with ERP at the kind of lofty levels we're seeing now. This next chart provides a zoomed-out look at ERP plotted against the SPX on a logarithmic scale.
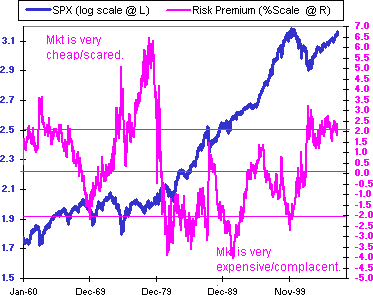
While it is always possible for a one-off crisis to tank the stock market hard on a short-term basis (in this case the potential exists for a liquidity crisis to occur if a sustained panic develops to unwind the Yen Carry Trade), or for unanticipated factors to profoundly damage the global economy, it looks more to me as though we are seeing a relatively minor adjustment that is coming at precisely the time that our cyclical charts anticipated it, albeit more suddenly and severely than we had expected.
Please recall that last week we showed the following chart.
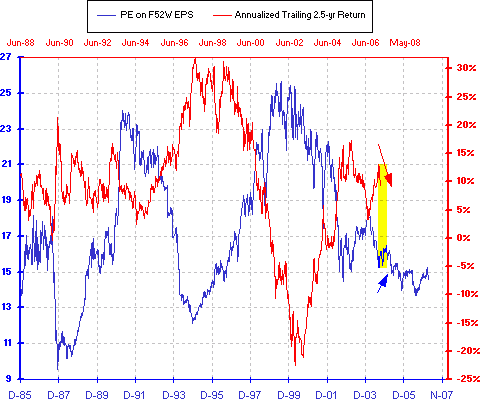
And that we described our expectation that the red line (SPX annualized 2.5-year appreciation) would regress down toward the 8% level by the end of June. Well, last week the red line took a whopping big step down from 11.4% to 9.2%, covering almost 2/3 of the distance remaining on its journey from 13% to 8%.
So, is there something to worry about? You bet. We should all be worried about whether the lemmings run back into the Yen so furiously that they unbalance the global financial markets for more than just the short term. But we should also be aware that this would be an undesirable outcome for virtually everyone on the planet and that letting the situation get out of hand would be something that a lot of policy-makers across the globe would be working against. So, I suspect that we should still regard the "catastrophe" scenario as a low-odds one.
As things stand currently, the high-probability bet would still appear to be that a relatively virtuous economic cycle is intact and that, as per the chart above, we will tend to see positive performance from the SPX on a cyclical basis, at least into the latter part of this year, albeit with some choppiness between now and the summer.
Much of the work of this corrective phase has been done quickly. And bearishness is now running at a high level, as evidenced by the new all-time high in the Aggregate Put/Call Ratio 5-dma, which is a very informative contrarian indicator.
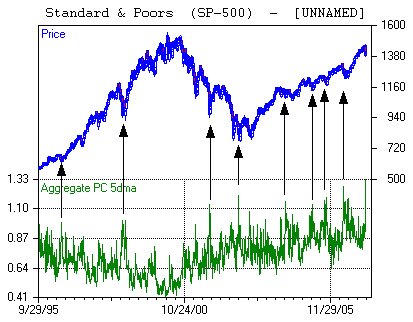
While it's a little tough to see on this long-term chart, extremely high levels on this indicator have a high correlation to local lows on the SPX.
Of course anything's possible. And it's possible that this time this indicator will fail to mark a tradable low. But the sudden, severe rise in pessimism, while at least somewhat warranted, also looks to be overdone.
We'll find out more about this market's mettle when we see how it reacts to last week's abrupt change of character. We would expect a bounce this coming week. If a bounce does not come, well, that would be a significant negative for the market's mid-term prospects. And if it does come, then we'll be gauging the quality of that bounce with all the measuring tools at our disposal.
Best regards and good trading!
By Adam Oliensis
Editor The Agile Trader
In 2007 the Agile Trader Index Options Service has closed trades for gross gains of +34%, +8%, +15%, and +31% for a gross total of +88% in position gains with no losing trades. In 2006 the System grossed +682% in position gains. (Of course, gross portfolio performance depends upon asset allocation.) If you would like to read more about The Agile Trader Index Options Service, CLICK HERE. And if you would like a free 1-month trial to the service (offered for a limited time), CLICK HERE and then click SUBSCRIBE .
After the Great Bear Market of 2000-2002 every single trader I knew from “back in the day” was wiped out. I got hurt too. Big time. The game had changed on so many different levels that everything I thought I knew turned out to be essentially useless. So, I started over. From scratch. I began to try to understand what was really driving the markets. I began the search for a trading model (or system) that would work in bull markets, bear markets, and trendless markets as well. I began the search for a system that would help to minimize the stress of trading too. Why? Because, the wild, emotional swings were taking their toll on my personal life, on my marriage, and on my relationships with my kids. And if our results using the Dynamic Trading System are any indication, we have found what we were looking for!
DISCLAIMER - All securities trading, whether in stocks, options, or other investment vehicles, is speculative in nature and involves substantial risk of loss. We encourage our subscribers to invest carefully and to utilize the information available at the websites of the Securities and Exchange Commission at http://www.sec.gov and the National Association of Securities Dealers at http://www.nasd.com . You can review public companies filings at the SEC's EDGAR page. The NASD has published information on how to invest carefully at its website. We also encourage you to get personal advice from your professional investment advisor and to make independent investigations before acting on information that we publish. Most of our information is derived directly from information published by companies or submitted to governmental agencies on which we analyze and/or rate from other sources we believe are reliable, without our independent verification. Therefore, we cannot assure you that the information is accurate or complete. We do not in any way warrant or guarantee the success of any action you take in reliance on our statements, ratings, or recommendations.
© 2005-2022 http://www.MarketOracle.co.uk - The Market Oracle is a FREE Daily Financial Markets Analysis & Forecasting online publication.


