


Stock Market ECB EQE week
Stock-Markets / Stock Markets 2015 Jan 25, 2015 - 12:21 PM GMTBy: Tony_Caldaro

 After ECB EQE rumors surfaced over the holiday the market gapped up to SPX 2029 on Tuesday, having closed the previous week at 2019. The gap up was immediately sold off to SPX 2004. Then despite a gap down opening on Tuesday the market worked its way higher until a 1.2tn Euro EQE was announced prior to the open on Thursday. The market hit SPX 2065 on Thursday, then pulled back on Friday. For the week the SPX/DOW were 1.25%, the NDX/NAZ were 3.00%, and the DJ World was 1.90%. On the economic front weekly reports were solidly to the upside. On the downtick: building permits. On the uptick: housing starts, the FHFA, existing home sales, leading indicators, the monetary base, and weekly jobless claims improved. Next week’s reports will be highlighted by the FOMC meeting and Q4 GDP.
LONG TERM: bull market
This week the ECB won a three year battle and became an autonomous central bank versus just another political arm of the EU. It had to go to court to do it, and the European Court of Justice ruled in their favor. Now the ECB, like the FED, can go about meeting their dual mandate (2% inflation and low unemployment), without political stone walling by EU member countries. They kicked off their victory by announcing a 60bn Euro per month QE program (EQE) starting in March and lasting until at least September 2016, if not longer. This program should expand the major bank reserves within the entire EU, just like the QE programs did in the US. A safer more liquid banking system, offers banks the needed excess reserves to be deployed after this deflationary secular cycle ends, and the next real secular growth cycle begins by the late teens or early 2020’s.
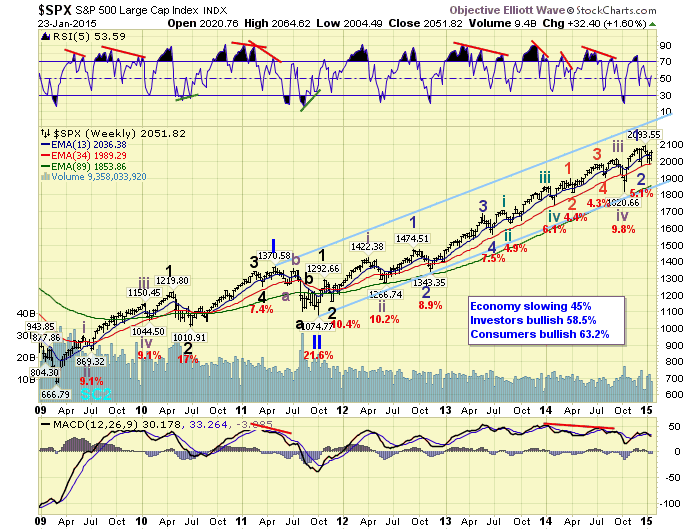
Our long term bull market count remains intact. We continue to count this bull market as a Cycle wave [1] from the March 2009 low. This five Primary wave bull market has only completed Primary waves I and II in 2011. Primary wave III has been underway since the October low. While Primary III has been extending it has also alternated with the wave structure of Primary I. Both naturally divided into five Major waves. But while Primary I had a subdividing Major wave 1 and simple Major waves 3 and 5, Primary III has had a simple Major wave 1 and a subdividing Major wave 3. When Primary III does conclude a steep Primary IV correction should follow. Then a rising, to new highs, Primary wave V should end the bull market. In the mean time we continue to track Major wave 3 of Primary wave III.
MEDIUM TERM: uptrend
The uptrend that started in mid-December at SPX 1973 rallied to new highs by late December, but has since pulled back and entered a trading range. After a decline to SPX 1992 by early-January the market rallied to 2064, then declined to 1988 by mid-month. Since that SPX 1988 low on January 16th the market has been somewhat choppy in its rally to 2065 on Thursday. The somewhat range bound January activity offers two, and possibly more, medium term counts.
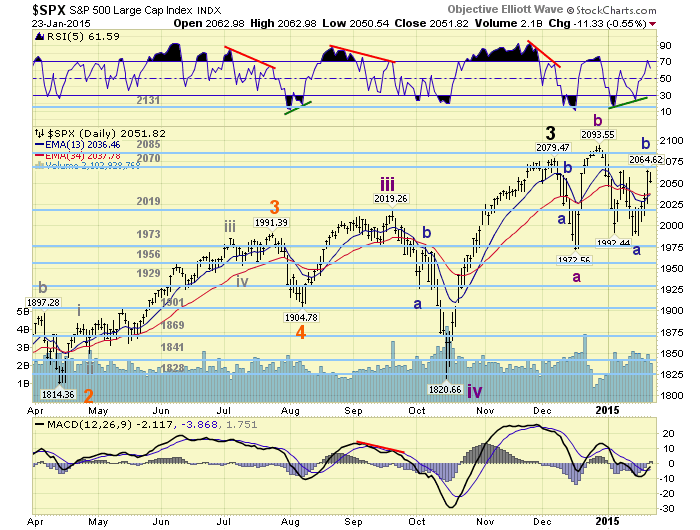
The first we have been tracking on the daily chart above. It suggests Major wave 3 actually ended at SPX 2079 in early-December, and the market has been in an irregular Major wave 4 since then: Int. A 1973, Int. B 2094, Int. C still underway. Should the market fail to make much upside progress over the next week or two, this count would take preference over the other count we have been tracking. Which is posted below in the short term section. There are other counts, but we do not see the need to further clutter the situation with additional counts at this time, until the current situation clears.
The daily chart displayed a positive divergence at the recent SPX 1988 low, and the market has nearly rallied 80 points off that low. This is generally bullish. Also the ECB is starting EQE in March, which is also bullish. But there is plenty of time for the markets to gyrate before it actually starts. Medium term support remains at the 2019 and 1973 pivots, with resistance at the 2070 and 2085 pivots.
SHORT TERM
The preferred count, which is posted below, suggests only Minor wave 1 of Intermediate wave v completed at SPX 2079 in early December. Then after a Minor wave 2 correction to SPX 1973 in late-December the market began Minor wave 3. Thus far Minor wave 3 has been a bit choppy, with Minute wave i topping at SPX 2094, Minute ii bottoming in the form of a flat at 1983, and Minute iii underway now.
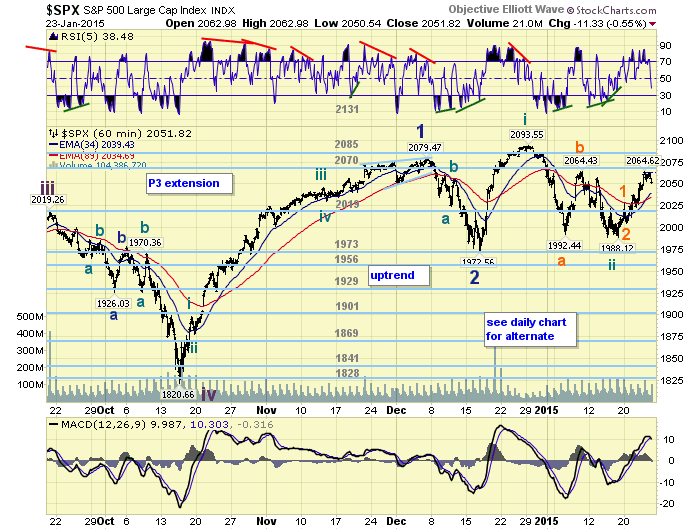
Within Minute iii we have also identified Micro wave 1 at SPX 2029, Micro 2 at 2004, and Micro wave 3 underway. Should this be the correct count, the current advance should be the strongest part of the uptrend. Currently the market is having some problems overcoming the SPX mid-2060’s, which is the lower end of the 2070 pivot range and the Micro b wave high of the Minute ii flat. Once cleared the market needs to then clear the 2070 pivot, the 2085 pivot, and then SPX 2094 to get Micro wave 3 truly underway.
Normally, during this bull market, steady overhead resistance has often been cleared by a gap up opening or some news event during the trading hours. Should the market fail to clear these levels over the next week or so, this count will likely fail. Should the market drop below SPX 2029 this count will likely fail as well. Short term support is at SPX 2029 and the 2019 pivot, with resistance at the 2070 and 2085 pivots. Short term momentum ended the week below neutral.
FOREIGNS MARKETS
The Asian markets were nearly all higher on the week for a 3.0% gain.
The European markets were all higher on the week for a huge 5.3% gain.
The Commodity equity group were mostly higher and gained 3.3%.
The DJ Word index gained 1.9%.
COMMODITIES
Bonds continue to uptrend but lost 0.1% on the week.
Crude remains in a downtrend and lost 6.8% on the week.
Gold remains in an uptrend and gained 1.0% on the week.
The USD’s uptrend continues as it gained 2.4% on the week.
NEXT WEEK
Tuesday: Durable goods, Case-Shiller, Consumer confidence and New home sales. Wednesday: the FOMC meeting ends with a statement. Thursday: weekly Jobless claims and Pending home sales. Friday: Q4 GDP, the Chicago PMI, Consumer sentiment and a speech from FED governor Tarullo at 12:45.
CHARTS: http://stockcharts.com/public/1269446/tenpp
http://caldaroew.spaces.live.com
After about 40 years of investing in the markets one learns that the markets are constantly changing, not only in price, but in what drives the markets. In the 1960s, the Nifty Fifty were the leaders of the stock market. In the 1970s, stock selection using Technical Analysis was important, as the market stayed with a trading range for the entire decade. In the 1980s, the market finally broke out of it doldrums, as the DOW broke through 1100 in 1982, and launched the greatest bull market on record.
Sharing is an important aspect of a life. Over 100 people have joined our group, from all walks of life, covering twenty three countries across the globe. It's been the most fun I have ever had in the market. Sharing uncommon knowledge, with investors. In hope of aiding them in finding their financial independence.
Copyright © 2015 Tony Caldaro - All Rights Reserved Disclaimer: The above is a matter of opinion provided for general information purposes only and is not intended as investment advice. Information and analysis above are derived from sources and utilising methods believed to be reliable, but we cannot accept responsibility for any losses you may incur as a result of this analysis. Individuals should consult with their personal financial advisors.
Tony Caldaro Archive |
© 2005-2022 http://www.MarketOracle.co.uk - The Market Oracle is a FREE Daily Financial Markets Analysis & Forecasting online publication.