


Are Stock Market Storm Clouds Massing?
Stock-Markets / Stock Markets 2015 Jan 20, 2015 - 06:12 PM GMTBy: Andre_Gratian

 Current position of the market
SPX: Long-term trend – Bull Market
Intermediate trend – Is the 7-yr cycle sketching an intermediate top?
Analysis of the short-term trend is done on a daily basis with the help of hourly charts. It is an important adjunct to the analysis of daily and weekly charts which discusses the course of longer market trends.
Daily market analysis of the short term trend is reserved for subscribers. If you would like to sign up for a FREE 4-week trial period of daily comments, please let me know: info@marketurningpoints.com
ARE STORM CLOUDS MASSING?
Market Overview
During the entire week, high volatility dominated the action which was predominantly on the downside. However, on Friday SPX re-tested the low that was made on Wednesday and when it held, buyers stepped in and were in charge for the rest of the day, creating a 26-point rally by the close.
Last week’s market action certainly did not invalidate my premise that the 7-year cycle top could be taking hold. But, as I warned in the last letter, several weeks might be needed for confirmation. In the meantime, the base that was formed over the past two days has enough of a count to potentially allow the index to rally toward its former high.
It should be noted that the decline stopped within a few points of an initial downside target. A projection to a lower level remains a possibility as long as Friday’s “bounce” does not evolve into a full-fledged rally.
Momentum: The weekly MACD moved a little lower after making a bearish cross but is not yet showing much downside momentum. By making a new low while SPX did not, the daily MACD has created some negative divergence. Friday’s rally only caused it to go sideways and it remains in a bearish cross position.
The weekly SRSI made a marginal new low which also created some negative divergence. The daily, however, turned up on Friday and came close to making a bullish cross.
Breadth: The price weakness was not shared by the breadth figures and the McClellan Oscillator only had a mild retracement, and ended the week about neutral.
Structure: We will need more data to know whether or not primary wave III has come to an end.
Accumulation/distribution: A large, long-term distribution pattern may have started. Short-term, a base may have been created if the pattern turns out to be accumulation and not re-distribution.
XIV: This indicator continues to retain its relative weakness to the SPX
Cycles: The 7-year cycle appears to be slowly getting a foothold.
Chart Analysis
We start with the weekly SPX (chart courtesy of QCharts, including others below) with the McClellan Summation Index (courtesy of StockCharts.com) posted underneath it.
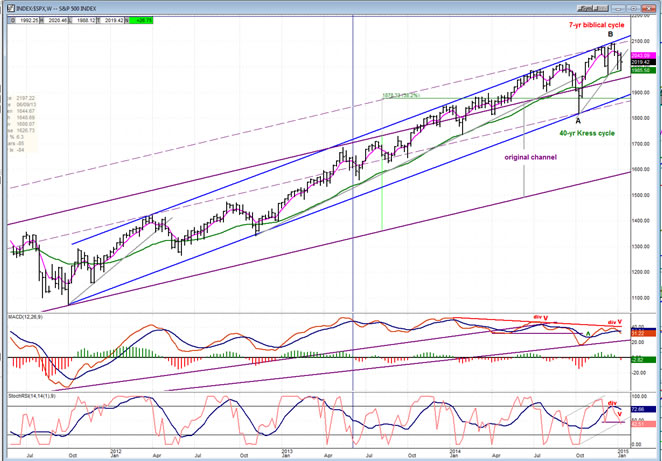
The weekly SPX chart (above) shows the original bull-market channel in purple and the intermediate trend channel which started in October 2011 in blue, whose strong uptrend took it above the original channel expanding it by .382. In spite of its strength, the SPX has been restricted by the top intermediate channel line. On the other hand, attempts at pulling away from it decisively have also been fruitless and have been limited on the downside by the (green) 30-wk moving average which, with a couple of exceptions, has provided consistant support. It is fair to say that when the index manages to close and stay below this MA, something will have changed in the supply/demand equation.
First of all, let’s admit that this change is inevitable, even if the status quo is maintained for another few weeks, and a change may happen sooner than most think. There are several reasons for this. Cyclicaly, a strong and predictable 7-year cycle is most likely in the process of topping and beginning to force the issue. Technically, I pointed out in the last newsletter that a slow but steady process of price deceleration has been in progress for the past year in the weekly MACD, and in the SRSI for the past six months. Last week’s correction has pushed both of these indicators a little lower but they have not yet started a full-fledged decline. In order to reverse this weakening trend, SPX would have to start another impressive rally which would nullify the on-going deceleration process.
This is not likely when you consider the fact that this slow but inexorable deterioration process is also occuring in the breadth index. The NYSI (which is posted under the SPX chart) is showing a pattern similar to the price index. A series of lower peaks has taken place in NYSI since its initiall thrust in early 2012. It is also evident in the increasing relative weakness of that index to the SPX (depicted by the black line) and in the weekly MACD. Furthermore, note that this process seems to have accelerated in the past few weeks. This could suggest that the day of reckoning -- when the SPX will decisively break below its 30-wk MA -- is not too far off.
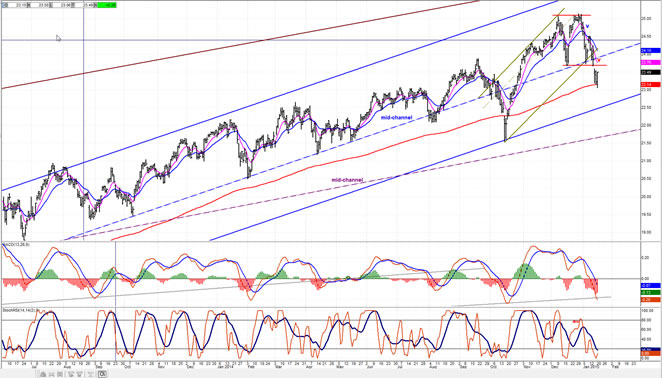
Only a six-month portion of the daily chart has been posted for a closer look at the recent price action. Here, we can see that the rally from 1820 did not quite make it to the top of the channel, but not by a wide enough margin to be significant. The short-term channel that was created and which ended in a double top was recently breached; but the (green) mid-channel line has, so far contained attempts at establising a short-term downtrend and restricted the price action to the top portion of the intermediate channel where the current bull/bear skirmish is taking place.
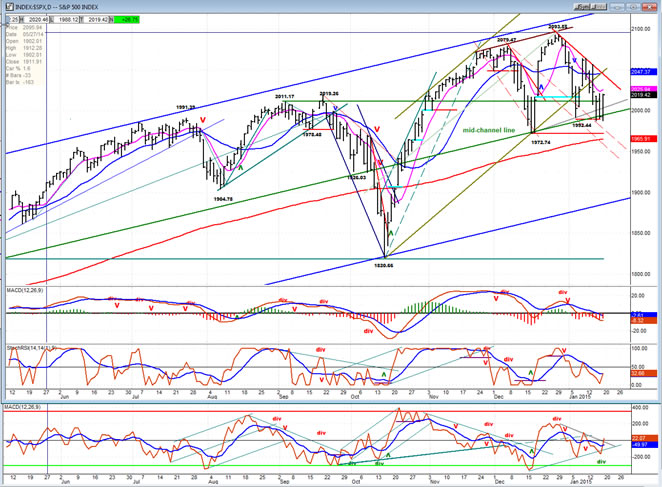
If the bulls prevail, they will have managed to preserve the intermediate uptrend for another day or another week. Whereby, if the bears succeed in taking prices lower, there is a good chance that they will push their advantage at least to the 200-DMA before the bulls can regroup.
On the re-test of the 1989 level, the A/D oscillator created some positive divergence, which could mean that the decline may have been interrupted for a few days, although this divergence was not shared by the price momentum indicators and it is now a question of whether the red downtrend line can be exceeded. If so, if the former short-term high of 2064 can also be overcome.
The three SPX time frames that are shown in this report are not in perfect synchronization. The indicators of the weekly charts are in a downtrend, the daily chart’s are trying to turn up, and the hourly chart indicators are becoming overbought. This could lead to a stand off over the near term, and perhaps even favor the downtrend when the hourly indicators turn down again.
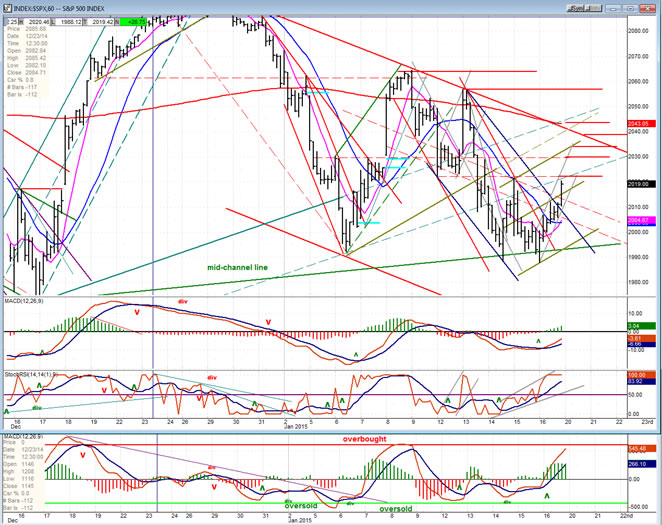
We can easily discern the various levels of resistance that the SPX will have to overcome as it attempts to extend Friday’s rally. The first is around 2022, just above where we ended up on Friday, followed by six more all the way up to 2064. I have marked them all with horizontal red lines. Since two of the hourly oscillators are already at overbought levels, it is more than likely that Friday’s bounce will soon come to an end and start retracing. When all three oscillators turn down, the SPX will be susceptible to extending its decline below 1989.
Last week’s pull-back by SPX came close to fullfilling an initial downside Point & Figure target. However, if it should decline below 1972 before making a new high, all the trading above that level will look like a large distribution top resulting in a substantially lower count.
XIV (Inverse NYSE Volatility Index) - Leads and confirms market reversals.
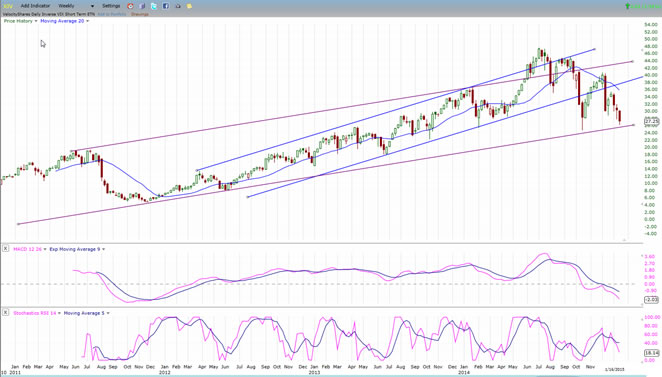
The above chart gives us the total history of XIV. Since it was born after March 2009, it is not possible to draw a channel which goes back to the beginning of the bull market. We can, however, draw one which encompasses the entire intermediate trend from October 2011 (blue). The index has already breached that channel by a sizeable margin and it is now challenging the lower trend line of its long term channel.
Needless to say, its relative weakness to SPX is now very pronounced and this is highly bearish for the market.
- XLF (Financial Sector SPDR) - Historically a market leader.
- XIV, XLF and XBD probably rank as some of the top leading indices. XIV was discussed above. It is followed by an analysis of XLF, and then XBD. When warnings of a trend reversal begin to appear, they normally show up in these indices. XIV was the first to show marked relative weakness to SPX. Over the past couple of weeks, it looks as if the other two have also joined it.
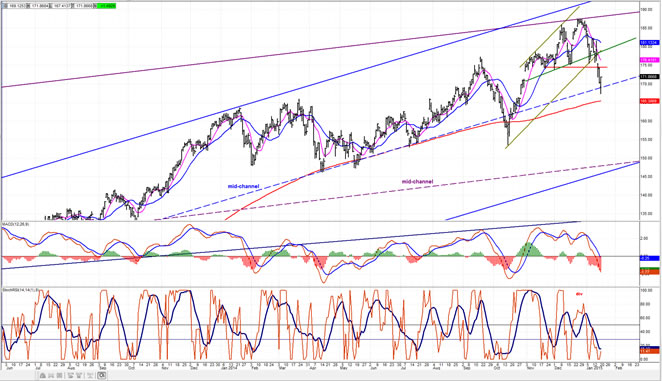
- The first hint of deceleration appeared when XLF failed to reach the top of its blue intermediate channel. After a short correction, the index moved back to its former high but could not exceed it, creating a double top before starting another pull-back. This time, the correction was more intense with the price not only breaking out of its rising short term channel, but dropping well below the level of the first correction all the way down to its 200-DMA where it found support. This price action has placed it in a downtrend with increasing relative weakness to the SPX. Unless it is immediately reversed, this is a bearish warning!
-
- XBD (American securities Broker/Dealer)
- Nearly identical action occurred in the XBD simultaneously: the failure to reach the channel high, the double top, and the establishing of a short term downtrend after moving out of the rising short term channel. XBD has also declined to near its 200-MA. The only difference being that XLF is showing a little more weakness because it has gone below its intermediate mid-channel line while XBD remains above it. The oscillators also are making similar patterns. The MACDs have started a steep downtrend and gone negative.
- These three indices have caught my attention because of their increasing relative weakness to SPX, and they deserve close monitoring over the next few weeks to see if this is only a false alarm or the real thing.
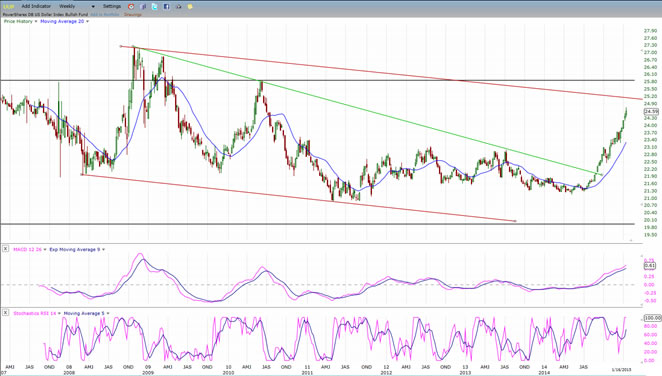
UUP (dollar ETF)
UUP continues to rise without interruption. This is not surprising since, as discused in the last letter, the base that was created over the past four years calls for much higher prices. However, the index is approaching the top of its long term channel where it should meet with some temporary resistance.
USO (US Oil Fund)
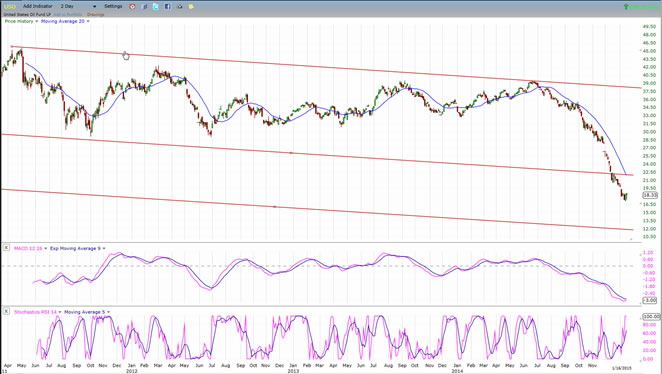
USO, influenced by the dollar’s rise to some extent, but also by the world-wide oil glut continues to drop towards the bottom of its long-term bearish channel. I had given WTIC a projection of 45 which has now been reached. This level should provide it with a temporary respite, but since that was only an interim projection, it should eventually resume its downward march toward 27-30. That should bring USO to about 10-13, a price level which would coincide with the bottom of its bearish channel.
“If, in fact, the 7-year cycle is beginning to roll over, its downward pressure is likely to continue for most of 2015.”
The appearance of a top of significant proportion increased with last week’s market action. The pattern which is being created on the long-term P&F chart is becoming impressive and if SPX drops below1972 decisively, everything above that level can be categorized as distribution, hinting at the start of a significant pull-back.
In addition to the price behavior of the index itself, two of the most trustworthy leading indexes (XLF and XBD) have joined XIV in diverging negatively from SPX.
In spite of increasing bearish warnings, these are still not sufficient to state with conviction that we are in the process of ending the intermediate trend which started in October 2011. More weakness will have to develop to confirm that what we are perceiving is factual.
FREE TRIAL SUBSCRIPTON
If precision in market timing for all time framesis something that you find important, you should
Consider taking a trial subscription to my service. It is free, and you will have four weeks to evaluate its worth. It embodies many years of research with the eventual goal of understanding as perfectly as possible how the market functions. I believe that I have achieved this goal.
For a FREE 4-week trial, Send an email to: ajg@cybertrails.com
For further subscription options, payment plans, and for important general information, I encourage
you to visit my website at www.marketurningpoints.com. It contains summaries of my background, my
investment and trading strategies, and my unique method of intra-day communication with
subscribers. I have also started an archive of former newsletters so that you can not only evaluate past performance, but also be aware of the increasing accuracy of forecasts.
Disclaimer - The above comments about the financial markets are based purely on what I consider to be sound technical analysis principles uncompromised by fundamental considerations. They represent my own opinion and are not meant to be construed as trading or investment advice, but are offered as an analytical point of view which might be of interest to those who follow stock market cycles and technical analysis.
Andre Gratian Archive |
© 2005-2022 http://www.MarketOracle.co.uk - The Market Oracle is a FREE Daily Financial Markets Analysis & Forecasting online publication.