


Gold Sheep Sheared
Commodities / Gold and Silver 2015 Jan 18, 2015 - 08:14 PM GMTBy: Austin_Galt

 Baa, baa. That's the sound of the sheep that follow the crowd spouting bunkum that gold can't go up if the US dollar goes up as well. This fallacy has been shown over the past couple of months for what it is - complete nonsense.
Both gold and the US dollar have surged in tandem the past couple of months. This is why I like to analyse each instrument on its own merits and not let my judgement of one be clouded by my view of another. This is often easier said than done mind you.
Let's put the US dollar aside and check out the technicals of gold. Let's begin with the monthly and weekly chart before wrapping it up by looking at the recent psychology of the gold market using the daily chart.
Gold Monthly Chart
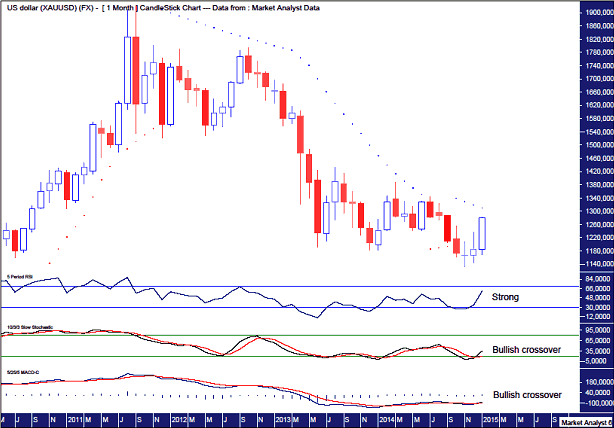
We can see the January candle is a big bullish one. Whether it finishes the month looking like that, I'm not so sure. Quite frankly, I doubt it. But let's come back to that later.
The Relative Strength Indicator (RSI) is looking strong and making new highs. Nice.
The Stochastic and Moving Average Convergence Divergence (MACD) indicators are showing recent bullish crossovers and have started trending up. Nice.
So, according to these lower indicators, the likelihood of higher prices in the months ahead is better than average.
However, price is nearing some resistance given by the Parabolic Stop and Reverse (PSAR) indicator which pertains to the dots on the chart. These dots stand at US$1310 and while I expect this resistance to eventually be taken out, I don't expect it to happen on the first attempt. Instead, I favour price being rejected at this resistance in the coming days. After price pulls back I expect the next rally will see price punch on through most likely in February.
Let's move on to the weekly chart.
Gold Weekly Chart
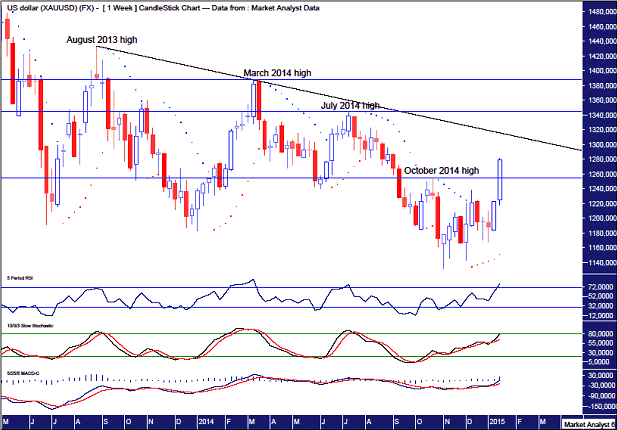
The same lower indicators are all looking bullish and trending up. The RSI has pushed into overbought territory while the Stochastic is close so a pullback would not look out of order shortly. The MACD indicator shows the averages starting to diverge and any pullback would likely see these averages return to normalcy as they continue trending up.
I have drawn several horizontal lines to denote previous swing high levels. Price has just recently busted the first of these being the October 2014 high. So we will have a higher high in place when price does correct. Breaking this previous swing high level has the bulls now hooting and hollering and rightly so. It is a positive development and augurs for higher prices over the coming weeks and months.
But how high?
I am targeting price to finally peak out somewhere between the July 2014 high at US$1344 and the March 2014 high at US$1387. I will be watching closely how price behaves around the July 2014 high as the possibility of price making a bearish double top there is a real one. I don't expect price to trade above the March 2014 high.
I have drawn a downtrend line along the tops of the August 2013 and March 2014 high. Price looks to be about to challenge this level but I favour a pullback first as price regroups and builds up the strength needed to bust on through.
The PSAR indicator has a bullish bias with the dots underneath price. I'd like to see price come back shortly to give this support a test. Any test should see this support hold before price zooms back up.
Gold Daily Chart
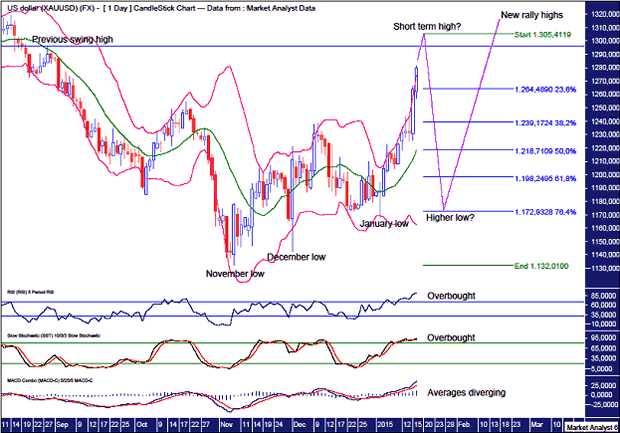
Let's look at this chart from a psychological perspective.
The November low at US$1332 was a false break low of the previous triple bottom support at US$1180. Breaking this level got the majority of gold commentators and speculators bearish. Gold sheep sheared!
The December low was a reaction to the Swiss gold vote that also got most gold commentators and speculators bearish. Gold sheep sheared!
We now have most gold commentators bullish after breaking the previous swing high from October 2014. This includes most of those that have already been sheared after previously being bearish. With this current bullishness in full swing I suspect they are all about to get sheared again with a sharp price drop. (One might wish to go short wool as I expect a surplus of supply!)
The RSI and Stochastic indicator are both currently overbought while the MACD indicator shows the averages diverging and looking in need of some "regression to the mean".
I have drawn a horizontal line to denote a previous swing high level set in August 2014 at US$1296. I favour price taking out this level before any correction commences.
From the monthly analysis, we know the PSAR resistance is at US$1310 so I am looking for a short term top somewhere below there and above US$1296. For the purposes of some Fibonacci analysis, I have selected the US$1305 level to be the coming top level.
I have added Fibonacci retracement levels of the move up from November low to the predicted coming short term high. I am looking for a deep retracement back to near the 76.4% level at US$1172. Price putting in a low there would make a higher low being above the recent January low at US$1167. Then the coast will be clear for price to make new rally highs.
I have added Bollinger Bands which show the January low bounced off the lower band and I'd like to see the coming pullback hit that lower band once again.
If price can drop sharply , which is my expectation, then a low in a couple of weeks around this 76.4% level would also be just above the weekly PSAR support as shown in the weekly analysis.
Finally, as many readers will know, I am viewing this current rally as the last bear market rally before the move to final lows sub US$1000 around mid 2015. So, considering this is a bear market rally and not the next bull market, it us understandable for the rally to be choppy and hence a sharp price drop shortly that gives up most of the recent 2015 gains would fit in nicely.
And as for the US dollar, who cares? This is gold analysis and I don't baa!
By Austin Galt
Austin Galt is The Voodoo Analyst. I have studied charts for over 20 years and am currently a private trader. Several years ago I worked as a licensed advisor with a well known Australian stock broker. While there was an abundance of fundamental analysts, there seemed to be a dearth of technical analysts. My aim here is to provide my view of technical analysis that is both intriguing and misunderstood by many. I like to refer to it as the black magic of stock market analysis.
© 2015 Copyright The Voodoo Analyst - All Rights Reserved
Disclaimer: The above is a matter of opinion provided for general information purposes only and is not intended as investment advice. Information and analysis above are derived from sources and utilising methods believed to be reliable, but we cannot accept responsibility for any losses you may incur as a result of this analysis. Individuals should consult with their personal financial advisors.
© 2005-2022 http://www.MarketOracle.co.uk - The Market Oracle is a FREE Daily Financial Markets Analysis & Forecasting online publication.