


From Gold Bear to Gold Bull?
Commodities / Gold and Silver 2015 Jan 16, 2015 - 04:55 PM GMTBy: Jordan_Roy_Byrne

 Bear markets end with extreme bearish sentiment but positive price action is needed before a trend change can be confirmed. That can include (among other things) breaking downtrends, breaking resistance and breaking the pattern of lower lows and lower highs. There have been positive developments for precious metals beneath the surface but Thursday's breakout in Gold is more significant. If Gold holds this breakout then it will be all but impossible to argue that it remains in a bear market.
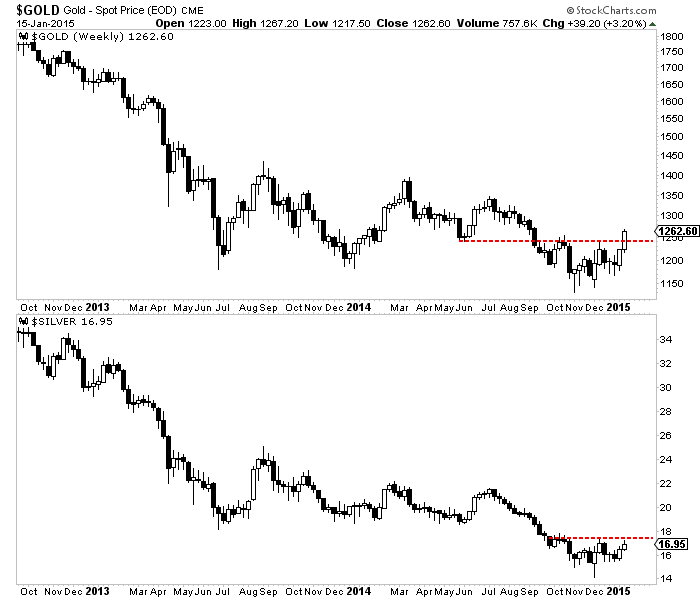
Below is a weekly candle chart of Gold and Silver. Thursday's Swiss-induced strength helped propel the yellow metal above key resistance at $1240-$1250. Over the past four months Gold has had every opportunity to sustain prices below $1200. Within that period Gold made four different lows from $1150 to $1200. The action of the past two weeks and the break above resistance is a strong signal of an important trend change. Silver breaking its resistance would offer further confirmation of a broad trend change in the sector.
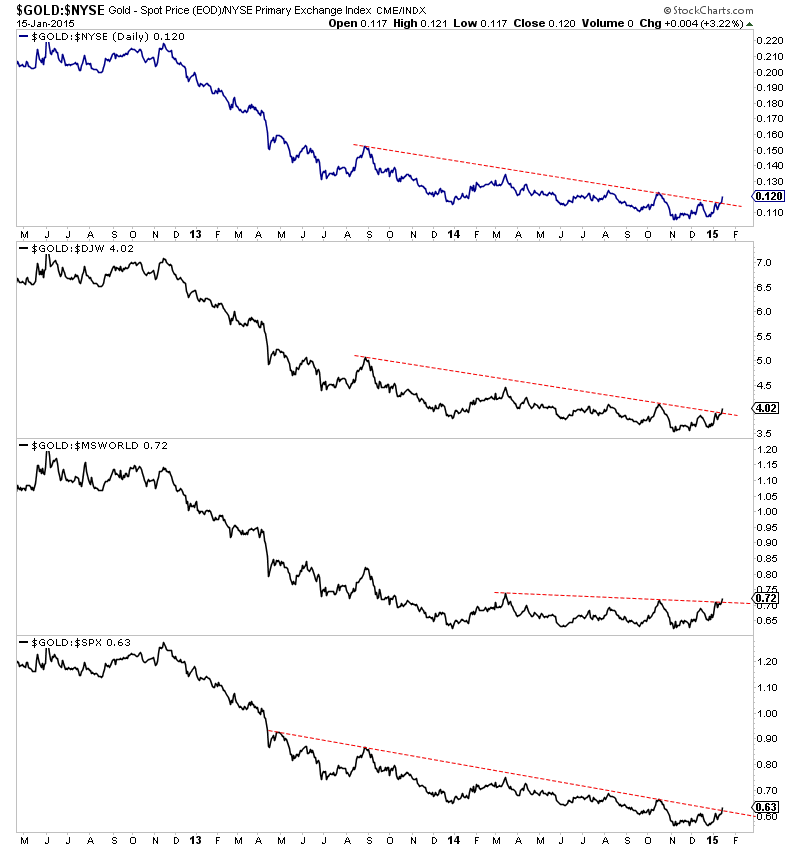
We've written often about Gold's relative strength and its importance in signaling a forthcoming trend change. On Thursday Gold closed at a 20-month high in Euro and foreign currency terms and is nearing a two year high against commodities. For months Gold had remained weak against US and global equities. At present Gold is starting to break those downtrends. Below we plot Gold against various equity indices (NYSE, Dow Jones World, MS World, S&P 500).
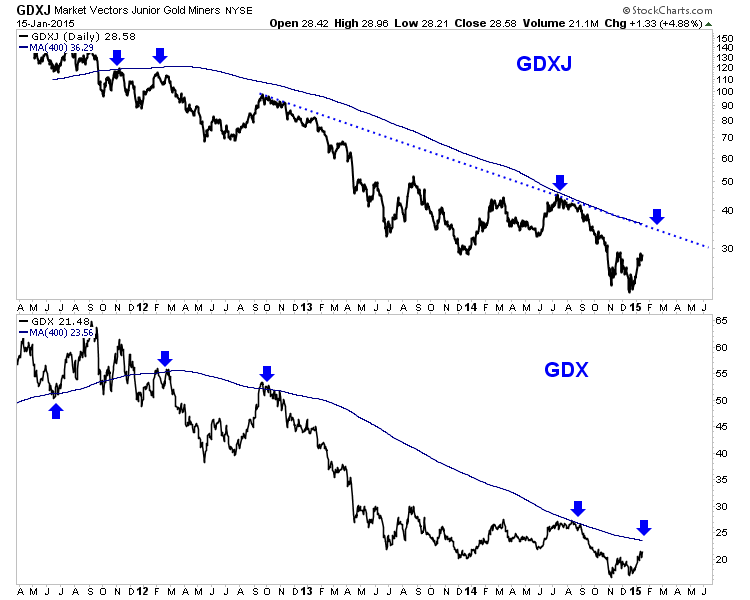
Meanwhile, the miners have confirmed the rise in Gold. With the exception of GDXJ, every major index has completed a double bottom and is trading around three month highs. The chart below shows the daily line charts of GDXJ and GDX. We include the 400-day moving average which is often an excellent indicator of the long-term trend. The next important resistance figures to be the 400-day moving average. That could coincide with Gold at $1280.
We continue to see signs that precious metals are moving into a new bull market. Gold has broken key resistance and is now breaking its downtrend against various equity indices. The miners are confirming Gold's rise. Moreover, let's consider the context of these recent developments. They are occurring on the back of the second worst bear market (in price and time) in precious metals in 70 years. While I believe the bear market is over, I'm looking for more confirmation in the weeks and months ahead. The next important confirmation will be if and when Gold and miners reclaim their 400-day moving averages.
Good Luck!
Bio: Jordan Roy-Byrne, CMT is a Chartered Market Technician, a member of the Market Technicians Association and from 2010-2014 an official contributor to the CME Group, the largest futures exchange in the world. He is the publisher and editor of TheDailyGold Premium, a publication which emphaszies market timing and stock selection for the sophisticated investor. Jordan's work has been featured in CNBC, Barrons, Financial Times Alphaville, and his editorials are regularly published in 321gold, Gold-Eagle, FinancialSense, GoldSeek, Kitco and Yahoo Finance. He is quoted regularly in Barrons. Jordan was a speaker at PDAC 2012, the largest mining conference in the world.
Jordan Roy-Byrne Archive |
© 2005-2022 http://www.MarketOracle.co.uk - The Market Oracle is a FREE Daily Financial Markets Analysis & Forecasting online publication.