


Will Collapse in Oil Price Cause a Stock Market Crash?
Stock-Markets / Financial Crash Jan 16, 2015 - 06:53 AM GMTBy: OilPrice_Com

 The Black Monday stock market crash of October 19th, 1987 was the largest one-day percentage decline in the Dow Jones Industrial Average. The crash was a genuinely perplexing event. To informed observers it seemed to have little basis in economic fundamentals. There were various "hand-waving" theories, including that the introduction of automated trading on the Dow had injected instability into the market. However, at the time, Black Monday appeared to come out of nowhere.
Perspective
In an analysis published in 2009, Therramus pointed out that Black Monday fell into a broader pattern in which nearly every stock market crash and recession of the preceding 50 years had occurred shortly after a large and abrupt change in the price of oil. In the case of the 1987 Dow crash, it was foreshadowed by a tumble in oil price that ensued in the wake of disputes within OPEC - which had come to a head in the previous year.
During the mid-1980s Saudi Arabia grew increasingly frustrated with cheating on agreed oil production quotas by other members of OPEC. In 1986 the Saudis gave up honoring their own quota commitments to the cartel and the price of oil plummeted.
Current Falls
Between July 2014 and January 2015 the price of oil plunged over 55%. One of the steepest legs of this decline was a 10% drop that occurred on Black Friday November the 28th following a meeting of OPEC. The ostensible reason for this fall was that the Saudis had refused to agree to production decreases being pushed by some OPEC members, instead choosing to let the market play out for the time being.
Analysis
Given this article's brash headline and its tenor so far you might be led to believe that we foresee a large fall in stock prices in the next year or the year after. Perhaps the 2014 Black Friday plummet in oil prices could spark a Black Monday-like stock market crash in 2015?
This is the 4th in a series of related articles written for Oil-Price.net (2009, 2011 and 2013). The last of these written in late 2013 had the prescient title "Oil Price Volatility on the Way". In this series, the theory is developed that since the year 2000 we have seen the emergence of an oscillatory pattern in oil price volatility. Moreover, it has been suggested that the mechanism driving this oscillation is a teetering imbalance between oil supply and demand that was set in motion when global production reached a plateau in the mid-2000s.
Methodology
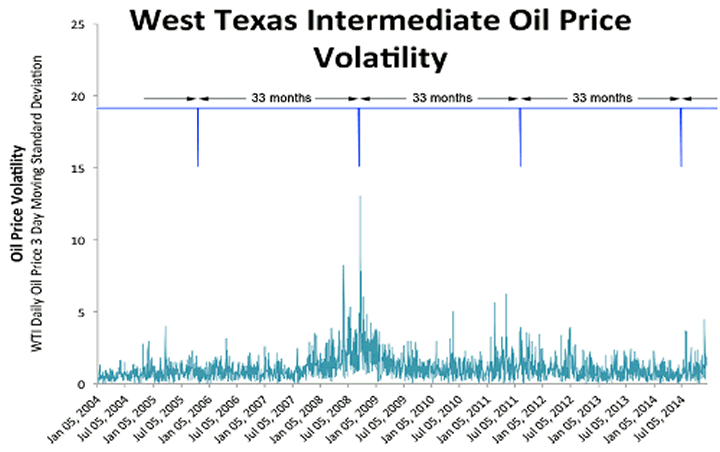
One of the tools that have been used to identify this oscillating signal is a mathematical technique called fast Fourier transformation. This algorithm indicates that since the year 2000 oil prices have adopted a cycle in which volatility spikes tend to occur every 32 to 34 months. As shown on the figure, the last of these crescendos in price variance happened in 2011 and before that there were surges in volatility in 2008/9 and 2005/6.
Further analysis of the figure is that the 2014 Black Friday "crash" in oil price is occurring "as near as dammit" on cue within this cycle. Thus, the current drop in oil prices provides the fourth confirmation that a long-term oscillation in oil price volatility has been established.
Causes
We have addressed previously how the fall in the price of oil originates from a power play by the Saudi Arabian elite and the US government. The Saudis want to squeeze out new production in the world as OPEC crumbles. Also one of the major new streams of oil flooding the market comes from the American shale oil revolution.
Market analysis shows that the new price levels of oil are caused by the simple mechanism of supply and demand. Globally, the 2014 slower economic growth in Europe and China took capacity planners and market makers by surprise; the developed world's drive to decrease carbon emissions is finally having an impact on the oil market through greater energy efficiency. Demand for oil declined unexpectedly in 2014.
An end to conflict and years of reconstruction brought major oil and gas suppliers in Libya, Algeria, Iran and Iraq back to the market in 2014. The rapid expansion of tar sands supplies from Canada and shale oil in the USA squeezed suppliers such as Nigeria and Venezuela out of the US market. The world's largest producers of oil – the USA, Russia and Saudi Arabia each had financial needs that prevented them from reducing production. Thus, there was no cut in production to match a fall in demand and the market became over supplied, causing a fall in prices.
Trends
The simplest explanation for the slump in oil prices is it falls in line with an established multi-year pattern that is being driven by supply and demand. The oil crash of 2014 was the most recent manifestation of a tidal ebb and flow in oil price volatility that has occurred every three years or so since at least the mid 2000s.
If one accepts that we are seeing the fourth confirmatory spike in a long-term pattern of oil price volatility, what is causing it and what can be expected next?
Projections
The mechanism of the oscillation is a natural occurrence, like the tides, which is anticipated to occur at the summit of a resource-depletion curve, such as at peak oil. Other mechanisms might include a direct role for human agency. Perhaps there are behind-the-scene players who have the means and persistence to rhythmically seesaw oil price over extended periods of time.
The simplest prognosis would be to anticipate that a fifth spike should occur sometime in 2017-2018. History teaches about the fall-out from surges in oil price variance – instability in various economic indices might be expected to occur in the next 6 to 12 months. When oil markets go crazy, in an upward or downward direction, bad things happen to the economy. The trajectories of changes that accompany volatility spikes, shown in the top chart, indicate that sudden drops may be worse augurs than abrupt upticks in oil price.
Possible Scenario
The mechanism by which a fall in the price of oil could trigger a collapse in the stock market lies in the financial devices used to fund oil exploration and exploitation throughout the world, and particularly in the United States. Modern oil exploration is financed through a range of methods including issuance of shares to increase capital, and raising debt through bonds and bank loans.
A shale oil well operating through hydraulic fracturing can cost $9 million to get into production. When oil was hovering close to $100 per barrel, banks were more than willing to finance billions of dollars worth of oil exploration projects. As far as banks were concerned these loans were backed by tangible assets and considered low-risk. It was (almost) like printing money. A price of $80 per barrel was seen as a floor in the profitability of shale oil. This took an average break-even price of $70 per barrel, plus a $10 margin for financing costs.
Today with oil under $50, many producers lose $20 for every barrel produced and will likely default on these loans, as outlined in last month's Falling Oil Price Slows US Fracking article. This loss will be passed to the banks that made the loans, as it happened with the housing sector in 2008.
A telltale sign of this is the recent 20% fall of high yield corporate bonds since this summer which follow very closely the fall in crude oil prices. Many investors are afraid of defaults in the high-yield market due to over-lending to the energy sector and are indiscriminately selling off "junk bonds." The downside of this corporate bond selloff across the board is that less favorable financing options will be available for other sectors, which in turn will spread the slowdown to the rest of the economy.
Simple mathematics reduces a credit-worthy company to bankruptcy – for example a company with a market capitalization of $50 million owing $9 million suddenly becomes a bad risk when its total value dives to $10 million thanks to the sudden switch from profit to loss caused by the fall in the price of oil. A loss of profitability causes a loss of share value – pension funds and investment houses have seen billions wiped off the value of their investments in a matter of a few months. The knock on effect of loss of value then permeates to the banking and insurance sectors, causing the value of stock in those companies to fall.
Not all shale oil exploitation was financed by loans and bonds. Derivatives have played a part, too and many of the main players in the fracking business have their prices set in futures contracts all the way into 2016. The holders of these obligations to buy will be in serious trouble if the oil price does not turn around by mid-2015 when many of these contracts fall due. The major Wall Street banks hold a total of $3.9 trillion worth of commodities contract, the bulk of which are based on oil and were written when oil seemed to be destined to remain above $80 per barrel. If the price of oil stays below $80, America's biggest financial institutions will have to beg – once again – the Fed (and the taxpayer) for help.
In addition to those companies that drill for oil and those that finance them, there is a large industrial sector supplying tools, chemicals and equipment to the oil industry and the value of shares in those companies will tank as oil production winds down. Major index component companies, such as GE and Halliburton will see a loss of business and an inability to cover investments and loans in their oil industry divisions. These financial shortfalls will affect dividend payments or force them to sell otherwise profitable divisions to cover their losses. When the value of index component companies falls, all index-linked investment funds fall into losses. Managers of these funds usually sell off profitable assets to meet their obligations. A sudden shortfall of cash caused by an unexpected fall in the oil price could then trigger a sell off on Wall Street in which case the price of all shares would drop under an urgent rush to sell.
Should energy loans start to default, we may be looking at a snowballing effect in the order of the 2008 banking crisis with a caveat: low oil prices do help reduce the cost of transportation and services and may be a blessing in disguise for the economy. However this plays out, our FFT analysis illustrates that volatility is on the cards. Fasten your seatbelts for a bumpy ride, and keep an eye open for opportunities. As Warren Buffett once said: "Be fearful when others are greedy and greedy when others are fearful."
Source: http://oil-price.net/en/articles/will-collapse-in-oil-price-cause-stock-market-crash.php
This article was written by Oil-Price.net which provides free information on crude oil.
© 2015 Copyright OilPrice.com- All Rights Reserved
Disclaimer: The above is a matter of opinion provided for general information purposes only and is not intended as investment advice. Information and analysis above are derived from sources and utilising methods believed to be reliable, but we cannot accept responsibility for any losses you may incur as a result of this analysis. Individuals should consult with their personal financial advisors.
© 2005-2022 http://www.MarketOracle.co.uk - The Market Oracle is a FREE Daily Financial Markets Analysis & Forecasting online publication.