


Gold Screaming Bear Market Targetting $650- Yorba TV Show
Commodities / Gold & Silver May 29, 2008 - 10:01 AM GMT

 Here are the topics for todays television show on www.yorba.tv Thursday at 4:00 pm EDT.
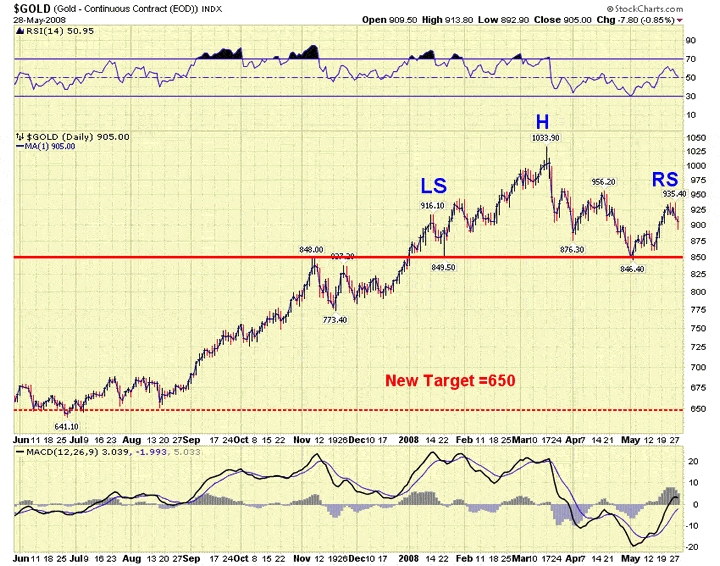
The first topic is the making of a head and shoulders pattern. Chart # 1
shows the price of gold for the past year. Let me point out an obvious
level of resistance on the way up last fall. In early November, gold
bounced up against resistance at 850 and fell back. On the second attempt,
it cut through resistance, but fell back to retest it in January 2008.
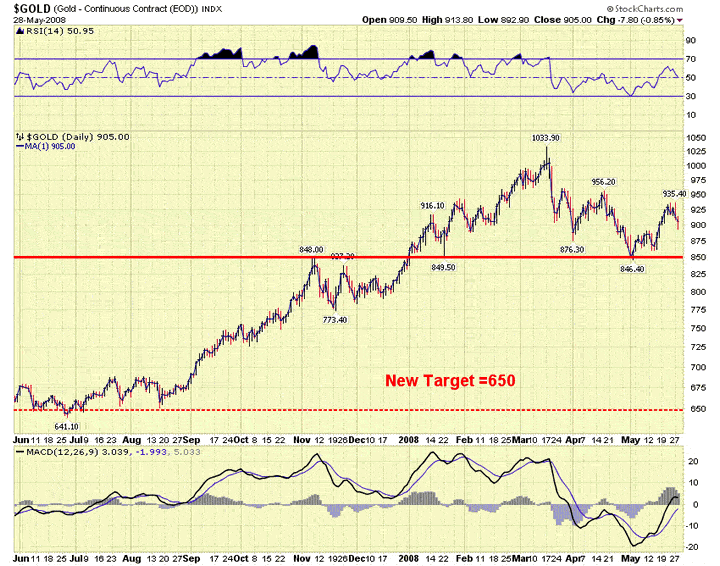
The
test was successful and gold rallied to new highs in March. The uptrend
broke and gold sold off, reaching 850 again in early May. Since then, it
has bounced but was 21 points shy of exceeding its prior high. That is very
important, since a failure to make a new high means that gold is now going
down to retest support again at 850. This is a textbook case of support and
resistance in a very clear context. Over 7 months, we have three direct
hits from above or below on the support/resistance line at 850.
What happens next?
A failure at the high means a retest of the low, so it is evident to most technicians that gold will retest support at 850 very quickly. If 850 doesn't provide a net for the price of gold, then support is broken. The rule of thumb is that, once support is broken from above, it becomes resistance from below. This hasn't occurred yet, but the indicators strongly suggest that it may. Once this occurs, the support/resistance line at 850 becomes what is called the neckline and we have a head and shoulders pattern. The formula for calculating the target for a H&S pattern is that the distance from the head to the neckline equals the minimum distance from the neckline to the target. That number comes to 667. The next thing we do is look for support in that area and find it at 640-650, the June 2007 low. This gives us the potential ultimate target for this decline.
What level of confidence can we give this projection?
Tom Bulkowski's
Encyclopedia of Chart Patterns gives this a 63% accuracy rate. However, you
may also combine other analyses to increase your probability of accuracy.
In this case, I have three other potential analyses that confirm the same
outcome, giving this a much higher probability.
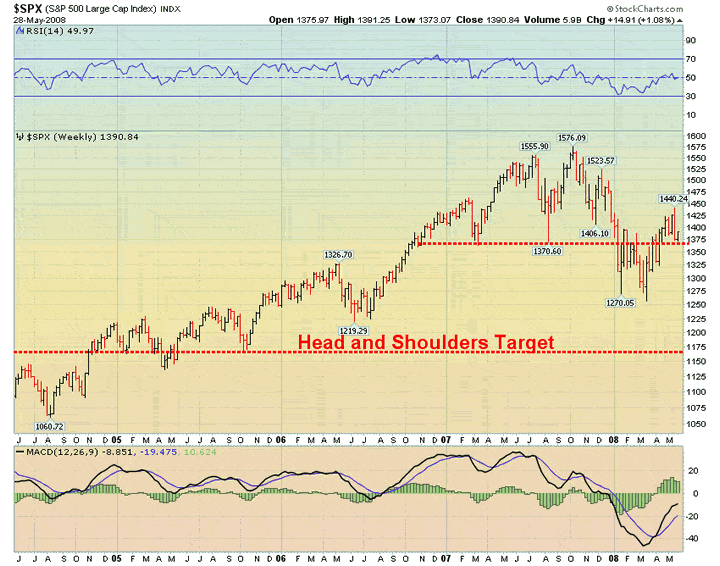
No. Look
at the SPX chart. It appears to be a massive head and shoulders pattern
that came back through after the violation. As of Wednesday night, it was
resting on the neckline again. Once it plunges through, it further confirms
the next target at about 1165 or even further below.
See you at 3:00 CST.
Which will it be? Stay tuned! on www.yorba.tv every Thursday at 4:00 pm EDT . You can find the archives of my latest programs by clicking here .
Please make an appointment to discuss our investment strategies by calling Claire or Tony at (517) 699-1554, ext 10 or 11. Or e-mail us at tpi@thepracticalinvestor.com .
Anthony M. Cherniawski,
President and CIO
http://www.thepracticalinvestor.com
As a State Registered Investment Advisor, The Practical Investor (TPI) manages private client investment portfolios using a proprietary investment strategy created by Chief Investment Officer Tony Cherniawski. Throughout 2000-01, when many investors felt the pain of double digit market losses, TPI successfully navigated the choppy investment waters, creating a profit for our private investment clients. With a focus on preserving assets and capitalizing on opportunities, TPI clients benefited greatly from the TPI strategies, allowing them to stay on track with their life goals
Disclaimer: The content in this article is written for educational and informational purposes only. There is no offer or recommendation to buy or sell any security and no information contained here should be interpreted or construed as investment advice. Do you own due diligence as the information in this article is the opinion of Anthony M. Cherniawski and subject to change without notice.
Anthony M. Cherniawski Archive |
© 2005-2022 http://www.MarketOracle.co.uk - The Market Oracle is a FREE Daily Financial Markets Analysis & Forecasting online publication.