Insane Santa Claus Stock Market Rally
Stock-Markets / Stock Markets 2014 Dec 19, 2014 - 12:51 PM GMTBy: Joseph_Russo
 Just a few short days ago, it appeared that bearish forces were destined to deny Wall Street its customary "Santa Claus Rally." Enter the Yellen Fed and the FOMC meeting on Wednesday, and suddenly, like magic, Santa and his proverbial rally appears to have found its way back on course to treat Wall Street with a healthy dose of Christmas Cheer.
How in the name of Jesus are long-term investors (let alone short-term traders) supposed to deal with this type of rollercoaster market from hell?
In our opinion, the only strategy's that have proven to work time after time are the ones that maintain exposure trends, and reverse course as necessary within quantified time-frame specific parameters.
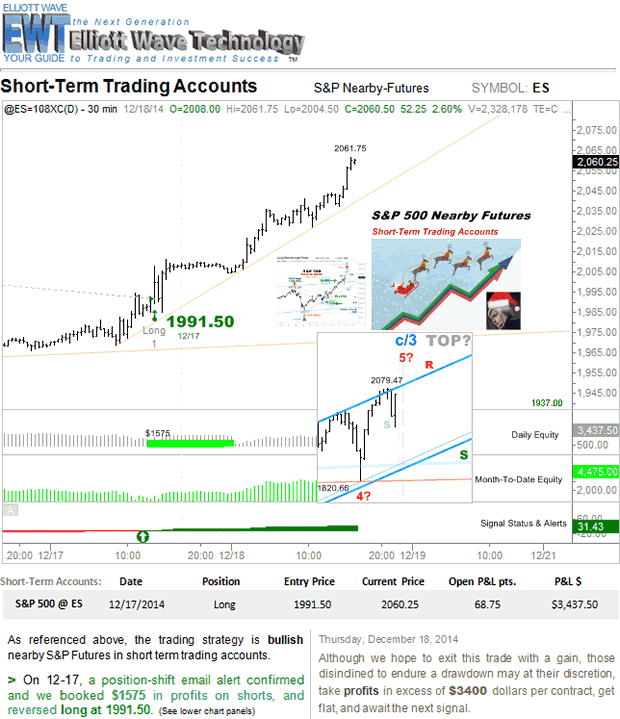
The chart illustrated is literally a page right out of today's Chart-Cast Pilot, which is a daily subscription service providing real-time email alerts throughout the day so that members may evaluate their trading positions, and consider aligning them with those taken within the Chart-Cast Pilot portfolio.

Regardless of time-horizon, trend-trading strategy's can never go long at absolute bottoms, nor are they able to move short at absolute tops.
Think about this for a minute. At or near absolute tops, the trend is still up so one must stay long the trend, and at or near absolute bottoms, the trend is still down, so one must maintain their short stance in kind.
Therefore, to trade/invest with trends successfully, it becomes an absolute necessity to wait for a confirming trend change reversal within each of the respective time-horizons in which one has engaged.
Then and only then, win, lose, or draw, does the green flag wave for you to pull the trigger and reverse course.
One week ago, on December 11, we got such a green flag to reverse short S&P futures via a bearish alert from the 2023 level. Yesterday, on 12-17, as stated in the page notes illustrated, our short-term trading strategy got a green flag to take profits on shorts and reverse back to the long side from the 1991 level.
On a mark-to-market basis, based upon trading one contract, short-term S&P futures traders have open profits in excess of $4400 thus far in December, and we current sport an open trade equity level in excess of $3400 per contract traded.
Summary
-
Ignore the news, noise, and volatility.
-
Trade or Invest with Trends appropriate to your time-horizon.
-
Quantify and measure the risks, efficacy, and profitability of strategy inputs that most effectively identify when trends have changed within each time horizon.
-
Continually adjust your timeframe specific market bias in accordance with the stance recommended by your trading strategies inputs.
Until Next Time,
Trade Better/Invest Smarter
By Joseph Russo
Chief Publisher and Technical Analyst
Elliott Wave Technology
Email Author
Copyright © 2011 Elliott Wave Technology. All Rights Reserved.
Joseph Russo, presently the Publisher and Chief Market analyst for Elliott Wave Technology, has been studying Elliott Wave Theory, and the Technical Analysis of Financial Markets since 1991 and currently maintains active member status in the "Market Technicians Association." Joe continues to expand his body of knowledge through the MTA's accredited CMT program.
Joseph Russo Archive |
© 2005-2022 http://www.MarketOracle.co.uk - The Market Oracle is a FREE Daily Financial Markets Analysis & Forecasting online publication.


