Stock Market Santa Mania Rally, Dow 18,000 New All Time High
Stock-Markets / Stock Markets 2014 Dec 06, 2014 - 02:29 PM GMTBy: Nadeem_Walayat
 The stock market's relentless santa rally grind higher on Friday put the Dow within a whisker of trading above Dow 18,000 for the first time ever! The trading session saw the Dow trade upto 17,991 by mid-day and then spend the next 2 hours flirting with a break above Dow 18k before trending lower into the close to still close at a new all time high of Dow 17,948.
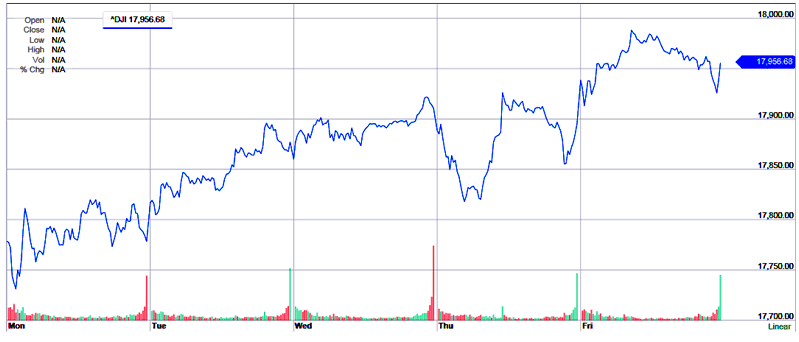
The end of the stock market world, crash is always coming perma bear crowd will have taken what they perceive as the satan rally and Friday's price action as a sign of FAILURE and thus the Dow HAS topped! Just as they have taken EVERY day that the Dow sets or retreats from a new all time high as THE TOP for the PAST 5 years! So will once more trundle out those long-term Dow charts, just as they have been doing for several years now to proclaim this is why this is the TOP - Looking at the distance from the 2007 top to now extrapolate where the Dow could next make its all time high some 10 years later AFTER an intervening bear market that never tends to materialise.
It's not rocket science its approx $75 trillion dollars of global printed money, that' right $75 trillion! that the financial markets are leveraged to potentially by as much as X50!, that is a hell of a lot of INFLATION! People that cannot understand this should NOT invest let alone commentate on markets. THIS RALLY is as a CONSEQUENCE OF THE INFLATION MEGA-TREND - Rampant money printing inflation, be it that the printed money is called government DEBT, QE or any other of a infinite number of government and central bank money printing schemes. Understand this - THERE CAN NEVER BE DEFLATION! It is an ILLUSION of minds stuck in a fantasy land of theoretical models where our current stocks bull markets just cannot exist. Central bank money printing is what dark matter is to the structure of the universe! For if it did not exist then yes we would have deflation but not only does it exist but its quantity is near infinite!
Whilst I may regularly ridicule the perma bears, in reality I find their high pitched top is in screaming commentary very comforting for as I have often pointed out that as long as the perma-crowd don't throw in the towel in a fit of collective amnesia and turn bullish then the stock market should continue to grind its way ever high.
However, on that note I am seeing some worrying signs of some of the perma-clueless that were never bullish for years and years when stocks were cheap apparently have started to slowly turn bullish. I see this manifesting in commentary implying that this could be one of the greatest bull markets in history. Something that I have voiced for the past FIVE YEARS as iterated in hundreds of articles and several ebook's in the Inflation mega-trend and stocks stealth bull market series (FREE DOWNLOAD).
Bears turning bullish is not what I want to be hearing from the perma-crowd, that's not the script they are meant to follow! Which means its going to be much tougher ahead unless the market gives the bears some rope to hang themselves with i.e. a significant correction.
My expectations for some time have been for the Dow to break above 18k by the end of December before entering into a significant correction during January 2015 as indicated by the following articles -
- 23 Nov 2014 - Manipulated Stock Market Short Squeezes to Another All Time High - The China Syndrome
- 16 Nov 2014 - Stocks Bull Market Grinds Bears into Dust, Is Santa Rally Sustainable?
- 09 Nov 2014 - Stocks Bear Market Catastrophe as Stocks Flash Crash to New All Time Highs
- 31 Oct 2014 - Stocks Bear Market Crash Towards New All Time Highs as QE3 End Awaits QE4 Start
- 12 Oct 2014 - Is the Stocks Bull Market Over? Dow Trend Forecast into End January 2015
Now, rather than the Dow breaking above 18k by the end of December and leaving aside the 10 years from now perma bear mantra, the Dow is clearly probably going to achieve Dow 18k far sooner which could be even as early as Monday morning!
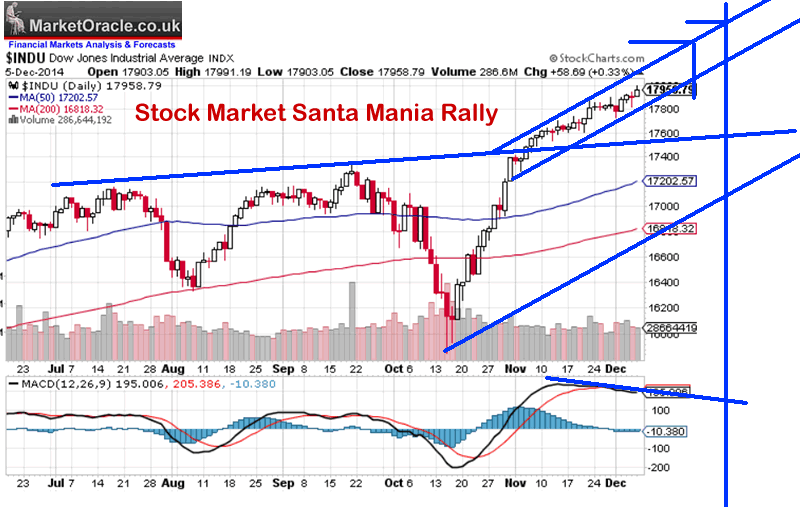
Technically the Dow is STILL over bought but marginally LESS than it was some 3 weeks ago and some 300 points lower as the slow climb higher has acted to unwind a little of the overbought state. The question is what happens next ? Can the Dow continue to grind its way slowly higher all the way into the end of the year. Sure it can, is it probable? That is tough because current market behaviour just reeks of obvious in your face market manipulation far beyond that which I model for in my trend analysis. Technically the market needs to correct NOW, but the market is in the grip of santa mania as it appears determined to imminently set a new all time high above Dow 18k.
In my opinion the stock markets relentless climb higher is setting itself up for a more significant EARLIER correction, which means that it is increasingly looking likely that the January correction could start BEFORE the end of this year. I'll come back to a more in-depth analysis of the stock market before year end so ensure you are subscribed to my ALWAYS FREE Newsletter to get this and other on going in-depth analysis and detailed trend forecasts in your email in-box, but I will leave you with this closing thought, those looking for an end of the bull market during 2015 will still be looking for the top by this time NEXT YEAR when we will probably be wondering whether the Dow will break above 20,000 before the end of the year!
Source and Comments: http://www.marketoracle.co.uk/Article48526.html
Nadeem Walayat
Copyright © 2005-2014 Marketoracle.co.uk (Market Oracle Ltd). All rights reserved.
Nadeem Walayat has over 25 years experience of trading derivatives, portfolio management and analysing the financial markets, including one of few who both anticipated and Beat the 1987 Crash. Nadeem's forward looking analysis focuses on UK inflation, economy, interest rates and housing market. He is the author of five ebook's in the The Inflation Mega-Trend and Stocks Stealth Bull Market series.that can be downloaded for Free.
 Nadeem is the Editor of The Market Oracle, a FREE Daily Financial Markets Analysis & Forecasting online publication that presents in-depth analysis from over 600 experienced analysts on a range of views of the probable direction of the financial markets, thus enabling our readers to arrive at an informed opinion on future market direction. http://www.marketoracle.co.uk
Disclaimer: The above is a matter of opinion provided for general information purposes only and is not intended as investment advice. Information and analysis above are derived from sources and utilising methods believed to be reliable, but we cannot accept responsibility for any trading losses you may incur as a result of this analysis. Individuals should consult with their personal financial advisors before engaging in any trading activities.
Nadeem Walayat Archive |
© 2005-2022 http://www.MarketOracle.co.uk - The Market Oracle is a FREE Daily Financial Markets Analysis & Forecasting online publication.


