


Global Crude Oil Consumption - What Countries Have Increased or Decreased Usage Since 2009?
Commodities / Crude Oil Dec 06, 2014 - 11:16 AM GMTBy: Mike_Shedlock

 Reader David Epperson sent in some interesting charts on global oil usage that he produced from U.S. Energy Information Administration (EIA) data. The data is through the end of 2013.
David writes...
Hello Mish,
I was curious how much oil consumption had declined over the last few years, so I went to the EIA web site, downloaded the consumption data and produced the following charts.
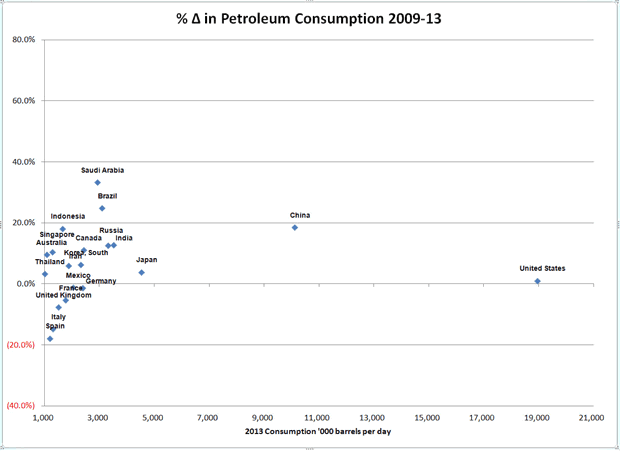
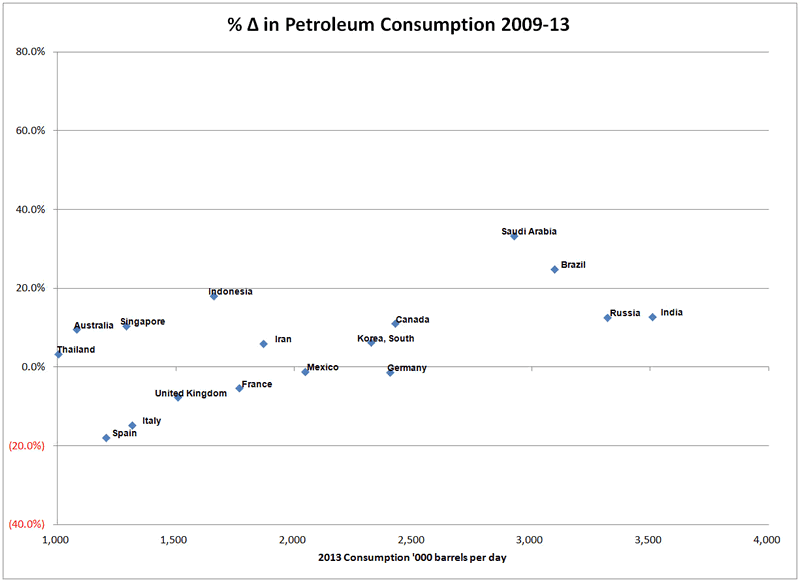
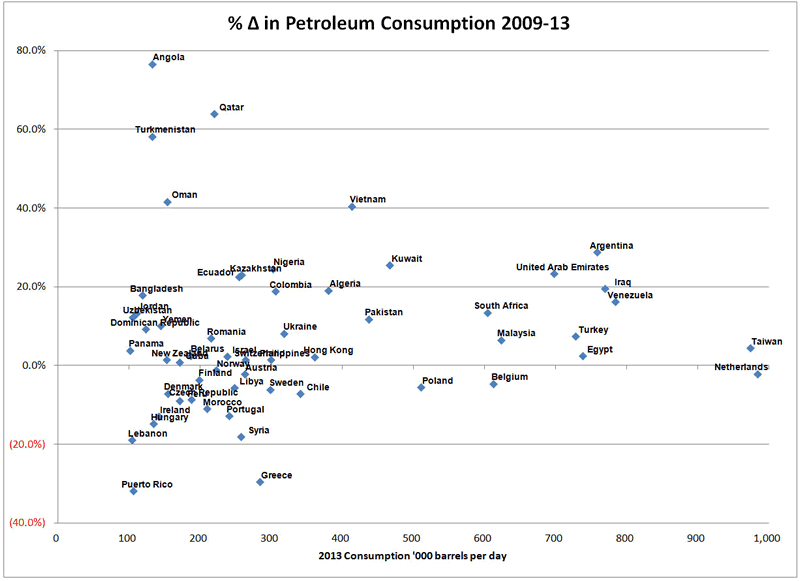
The data represents the percentage change in oil consumption from 2009 to 2013, the latest year non-OECD data were available. This is an absolute percentage change, and not an annualized change. For instance, oil consumption in Spain was roughly 20% lower in 2013 than in 2009. This was about the same rate of decline seen in war-wracked Syria. Greece was down even more, close to 30%.
In order to make the data labels readable, I've had to separate the charts into three. One shows countries in the 1 million to 20 million b/d group. The next shows the 1 million - 4 million club (all large countries excluding the US, China and Japan), and the next shows the 100,000 to 1 million b/d club.
I've excluded the 141 countries in the EIA database whose consumption was less than 100,000 b/d, since these only account for about 3.5% of total global demand.
The sum for the entire world was a 6.5% increase from 2009-13.
Best regards,
David
Large Users: 1-20 Million Barrels Per Day
Medium Users: 1-4 Million Barrels Per Day (Above Minus US, China, Japan)
Small Users: 100,00 to 1 Million Barrels Per Day
Observations
- Usage in the US is up only 1% since 2009
- Usage in most European countries is down since 2009 (Germany, UK, Spain, Italy, France, Finland, Sweden, Denmark, Portugal, Czech Republic, Ireland, Hungary, Netherlands, Poland)
- China, Japan, India, Russia, Brazil, Saudi Arabia are the largest countries where oil usage is expanding
- From a Peak Oil aspect China and Japan are the most troubling
Total Petroleum Consumption (Thousand Barrels Per Day)
BRICs and Saudi Arabia
Global oil consumption is up 6.5% from 2009-13. China alone accounts for 28.5% of that growth.
The top 5 global oil-growth contributors (China, Saudi Arabia, Brazil, India, and Russia) account for 66.7% of global oil usage growth since 2009.
BRIC (Brazil, Russia, India, and China) GDPs, especially China and India are highly unlikely to grow at projected rates, especially if global oil production does not keep up.
Japan is also on a dangerous path. Abenomics would look far worse were it not for declining energy prices.
By Mike "Mish" Shedlock
http://globaleconomicanalysis.blogspot.com
Click Here To Scroll Thru My Recent Post List
Mike Shedlock / Mish is a registered investment advisor representative for SitkaPacific Capital Management . Sitka Pacific is an asset management firm whose goal is strong performance and low volatility, regardless of market direction.
Visit Sitka Pacific's Account Management Page to learn more about wealth management and capital preservation strategies of Sitka Pacific.
I do weekly podcasts every Thursday on HoweStreet and a brief 7 minute segment on Saturday on CKNW AM 980 in Vancouver.
When not writing about stocks or the economy I spends a great deal of time on photography and in the garden. I have over 80 magazine and book cover credits. Some of my Wisconsin and gardening images can be seen at MichaelShedlock.com .
© 2014 Mike Shedlock, All Rights Reserved.
Disclaimer: The above is a matter of opinion provided for general information purposes only and is not intended as investment advice. Information and analysis above are derived from sources and utilising methods believed to be reliable, but we cannot accept responsibility for any losses you may incur as a result of this analysis. Individuals should consult with their personal financial advisors.
Mike Shedlock Archive |
© 2005-2022 http://www.MarketOracle.co.uk - The Market Oracle is a FREE Daily Financial Markets Analysis & Forecasting online publication.