Why the US Economy Is Temporarily Outperforming, In Two Charts
Economics / US Economy Dec 06, 2014 - 11:08 AM GMTBy: John_Rubino
 Today’s US employment report was the best in years. 300,000+ new jobs, rising wages, fewer people dropping out of the workforce, the whole package. Very hopeful. And also curious, since the rest of the world seems to be moving in the other direction. Consider:
British workers suffer biggest real-wage fall of major G20 countries
ECB Sharply Cuts Inflation, Growth Forecasts
Bundesbank slashes German growth forecast for next year
Japan’s economy likely shrank less than expected in third-quarter, but still fragile
China ‘triple bubble’ points to long slide for commodities
It’s a mess out there. So why isn’t it a mess here? And what does the divergence mean for 2015 and beyond? The answer begins with this chart:

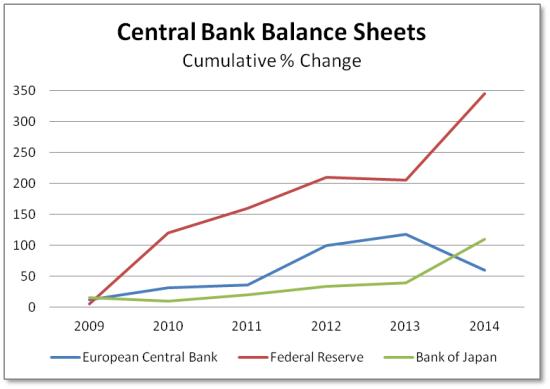
Between 2009 and 2013 the US Fed more than quadrupled the size of its balance sheet — which is another way of saying it pumped trillions of new dollars into the banking system. Most of this flowed directly into financial assets, spiking stock and bond prices and enriching the already rich. But lately a bit has found its way to Main Street via increased business hiring (hence the good jobs numbers).
The Bank of Japan, meanwhile, sat on its hands until 2013 when it belatedly started printing, about doubling its balance sheet in a single year. The European Central Bank was even tighter, actually shrinking its balance sheet in 2013, to barely more than its 2009 level.
Looking at this chart in the absence of any other data, one would expect the US to 1) have a weaker currency between 2009 and 2013 and 2) now be growing more robustly with higher inflation. And that’s exactly what has happened.
But next year is where things get interesting. Japan now intends to double the BoJ’s balance sheet by the end of 2015. And Europe, though it’s requiring some debate between Germany and the rest of the continent, will almost certainly join the party in January. The US, in contrast, intends to declare victory and stabilize the Fed’s balance sheet at these levels for a while.
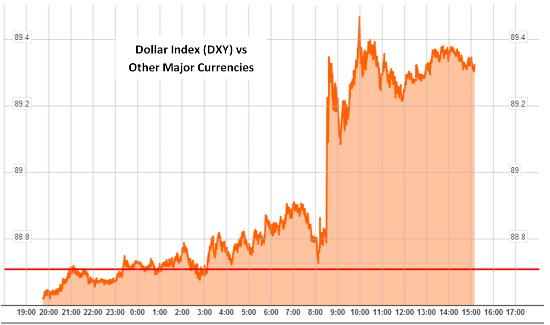
So if the money creation trends depicted in the previous chart are about to reverse, then it’s logical to expect 1) a strong dollar and weak yen and euro, and 2) recoveries (relatively speaking) in Europe and Japan concurrent with slower growth or actual recession in the US. Prediction #1 has already come true, with the dollar soaring by over 10% in the past few months and up big again today (Dec 5):

Prediction #2 will take a little longer but should be apparent pretty soon, especially if the dollar has another month like the last one.
With one big caveat: These kinds of currency war strategies work until they don’t. Each iteration requires more debt, and eventually that debt reaches a point where no amount of new play money can stop the bad-paper implosion. This might be that time, or it might not. We’ll only know in retrospect.
By John Rubino
Copyright 2014 © John Rubino - All Rights Reserved
Disclaimer: The above is a matter of opinion provided for general information purposes only and is not intended as investment advice. Information and analysis above are derived from sources and utilising methods believed to be reliable, but we cannot accept responsibility for any losses you may incur as a result of this analysis. Individuals should consult with their personal financial advisors.
© 2005-2022 http://www.MarketOracle.co.uk - The Market Oracle is a FREE Daily Financial Markets Analysis & Forecasting online publication.


