


AUD/USD Approaches Solid Support
Currencies / Austrailia Dec 03, 2014 - 12:16 PM GMTBy: Nadia_Simmons

 The Reserve Bank of Australia left its benchmark interest rate at a record-low of 2.50%, which pushed the Australian dollar higher against the greenback. As a result, AUD/USD bounced off yesterday’s fresh 2014 low, but will we see further rally?
In our opinion, the following forex trading positions are justified - summary:
EUR/USD: none
GBP/USD: none
USD/JPY: none
USD/CAD: none
USD/CHF: none
AUD/USD: none
EUR/USD
The medium-term picture hasn’t changed much as EUR/USD is still trading around the 127.2% Fibonacci extension. What can we infer from the very short-term picture? Let’s examine the daily chart and find out.
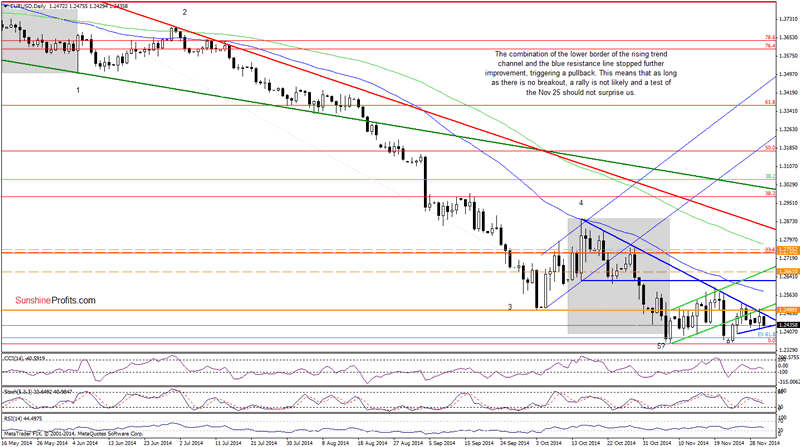
Looking at the above chart, we see that altough EUR/USD moved higher yesterday, the combination of the lower border of the rising trend channel and the declining blue resistance line stopped further improvement, triggering a pullback earlier today. What does it mean for the exchange rate? In our opinion, as long as the blue resistance line is in play, a sizable rally is not likely to be seen. Additionally, when we take a closer look at the daily chart, we can see that the exchange rate has been trading in a triangle (marked with blue) in the recent days. This means that if the pair drops below the lower line of the formation, we’ll see a test of the strength of Nov 25 low of 1.2399. However, taking into account the height of the triangle, it seem that we could even see a drop to the recent lows in the coming week.
Very short-term outlook: mixed with bearish bias
Short-term outlook: mixed
MT outlook: mixed
LT outlook: bearish
Trading position (short-term): In our opinion no positions are justified from the risk/reward perspective at the moment.
USD/CAD
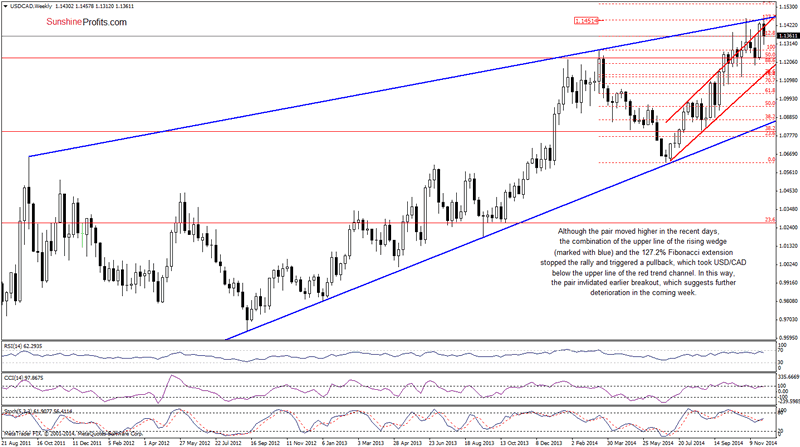
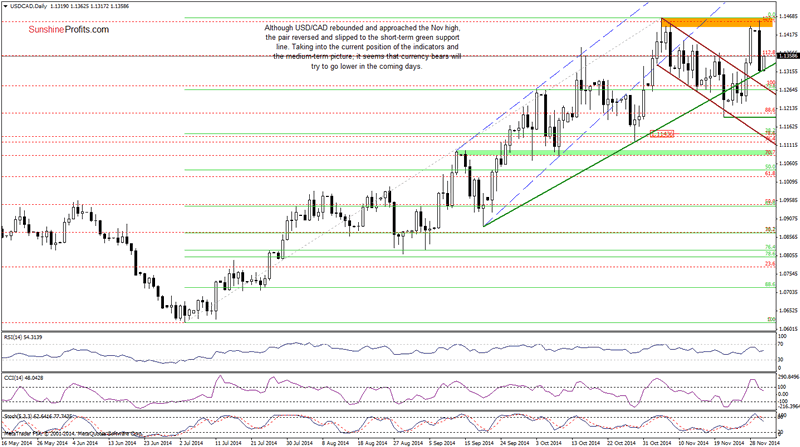
The first thing that catches the eye on the above chart is a breakout above the upper line of the declining trend channel. In our Forex Trading Alert posted on Nov 24, we wrote that such price action could trigger an increase to around the Nov high, which turned out to be correct. Despite this improvement, the strong resistance area seen on the weekly chart (created by the upper line of the rising wedge and the 127.2% Fibonacci extension) successfully stopped further rally. As a result, USD/CAD reversed and declined sharply to the short-term green support line (based on the Sep 19 and Oct 29 lows). As you see on the weekly chart, with this move, the exchange rate invalidated earlier breakout above the upper line of the red rising trend channel – similarly to what we saw at the beginning of Nov. Back then, such price action triggered a correction, which suggests that we could see further deterioration in the coming week. In our opinion, this scenario will be even more likely if the pair drops below the above-mentioned short-term green support line. In this case, the initial downside target would be around 1.1265, where the 23.6% Fibonacci retracement and the previously-broken upper line of the declining trend channel (marked with brown on the daily chart) are. Nevertheless, taking into account the current position of the indicators (the CCI and Stochastic Oscillator generated sell signals), it seems that currency bears will try to go lower in the coming days. If this is the case, the next target would be the bottom of the previous correction (the Nov 21 low of 1.1190).
Before we move to the next currency pair, we would like to draw your attention to the link between the Canadian dollar and crude oil. In the previous week, the Canadian currency moved sharply lower against the greenback weakened mainly by falling oil prices. Meanwhile, yesterday’s rebound in the commodity had a positive impact on the Canadian dollar and strengthened it against its U.S. counterpart. What does it mean for USD/CAD? Taking into account the current picture of crude oil (you can read more about it in our Oil Trading Alerts), we think that the loonie will increase, which will translate to the lower values of USD/CAD in the coming days.
Very short-term outlook: mixed with bearish bias
Short-term outlook: mixed with bearish bias
MT outlook: bearish
LT outlook: bearish
Trading position (short-term): In our opinion no positions are justified from the risk/reward perspective at the moment.
AUD/USD
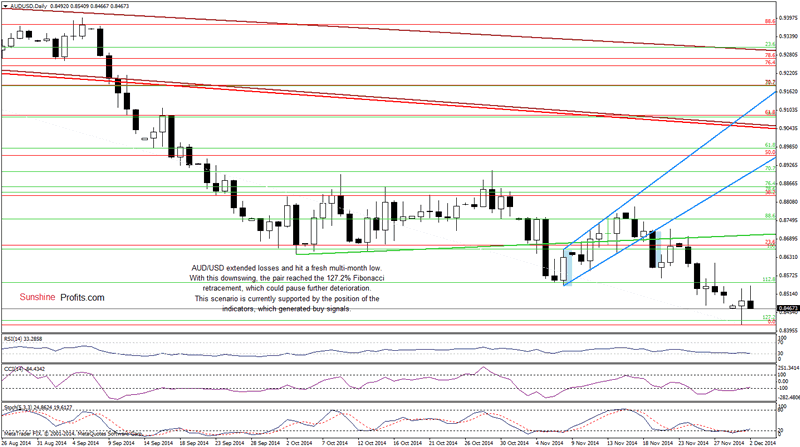
From this perspective, we see that AUD/USD extended losses and hit a fresh 2014 low yesterday. With this downswing, the pair reached the 127.2% Fibonacci extension, which could pause or even stop further deterioration. The reason? Many times in the past this extension has triggered a trend reversal (you can see an example of such price action on the weekly chart of USD/CAD). Therefore, taking into account the fact that history repeats itself and combining it with the current position of the indicators (the CCI and Stochastic Oscillator generated buy signals), it seems that we could see a rebound from here in the coming days. At this point, it’s worth noting that this scenario is also reinforced by the medium-term picture.
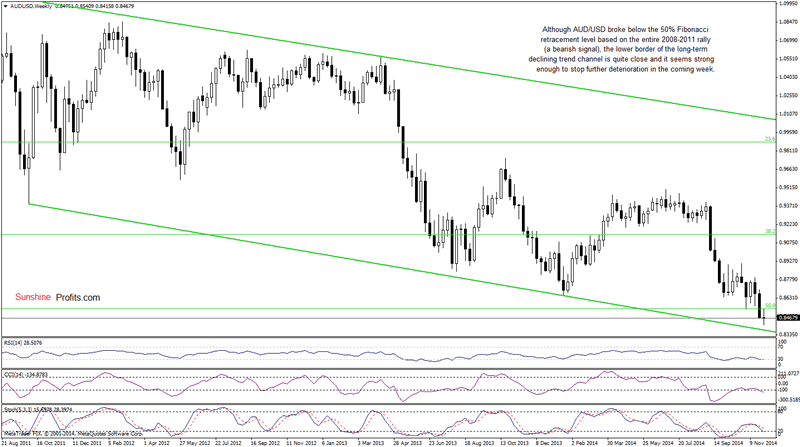
As you see on the weekly chart, although AUD/USD broke below the 50% Fibonacci retracement based on the entire 2008-2011rally (a bearish signal), the lower border of the long-term declining trend channel is quite close and it seems strong enough to stop further deterioration in the coming week.
Very short-term outlook: mixed
Short-term outlook: mixed
MT outlook: mixed
LT outlook: mixed
Trading position (short-term): In our opinion no positions are justified from the risk/reward perspective at the moment.
Thank you.
Nadia Simmons
Sunshine Profits‘ Contributing Author
Oil Investment Updates
Oil Trading Alerts
* * * * *
Disclaimer
All essays, research and information found above represent analyses and opinions of Nadia Simmons and Sunshine Profits' associates only. As such, it may prove wrong and be a subject to change without notice. Opinions and analyses were based on data available to authors of respective essays at the time of writing. Although the information provided above is based on careful research and sources that are believed to be accurate, Nadia Simmons and his associates do not guarantee the accuracy or thoroughness of the data or information reported. The opinions published above are neither an offer nor a recommendation to purchase or sell any securities. Nadia Simmons is not a Registered Securities Advisor. By reading Nadia Simmons’ reports you fully agree that he will not be held responsible or liable for any decisions you make regarding any information provided in these reports. Investing, trading and speculation in any financial markets may involve high risk of loss. Nadia Simmons, Sunshine Profits' employees and affiliates as well as members of their families may have a short or long position in any securities, including those mentioned in any of the reports or essays, and may make additional purchases and/or sales of those securities without notice.
© 2005-2022 http://www.MarketOracle.co.uk - The Market Oracle is a FREE Daily Financial Markets Analysis & Forecasting online publication.