Silver Open Interest Anomaly
Commodities / Gold and Silver 2014 Dec 02, 2014 - 06:17 PM GMTBy: DeviantInvestor
 Each week the CFTC publishes data from futures and options contracts for many commodities. Open interest shows the number of open contracts – one long for each short – in a particular commodity, say silver.
Usually price direction is consistent with open interest trend.
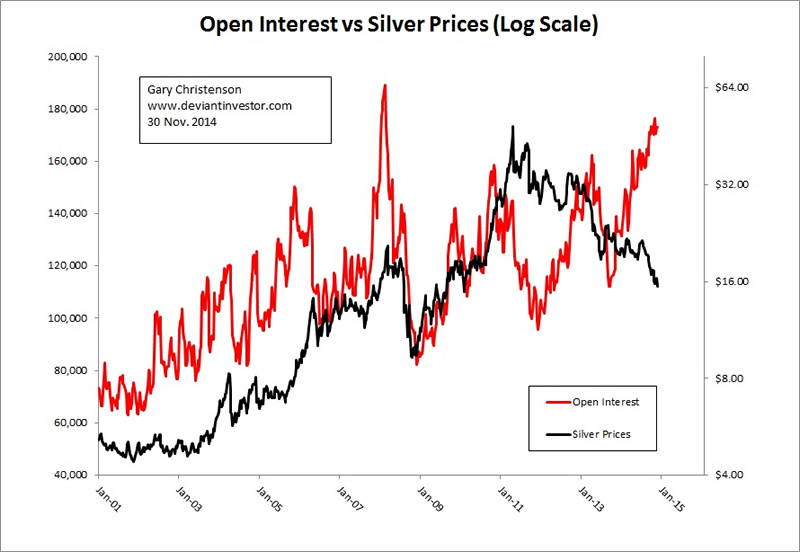
See the 14 year graph of open interest and prices in the silver market. Prices are shown on a log scale with silver prices in black, while open interest (per CFTC) is shown on the left in red.

Note the similarity in the trends for open interest and prices from January 2001 through the end of 2011.
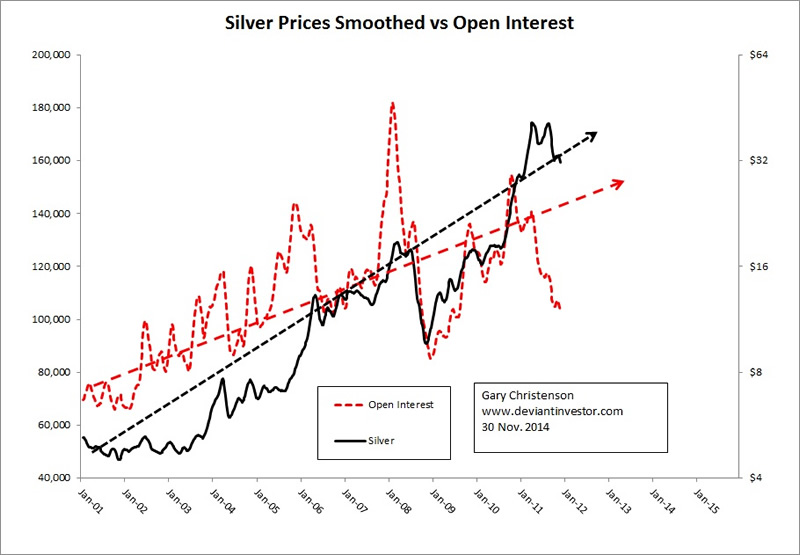
To more clearly analyze these trends, use a moving average for price and open interest to smooth the graphs. Now graph price and open interest (below) from January 2001 to December 2011. Excel calculated the statistical correlation at +0.56.

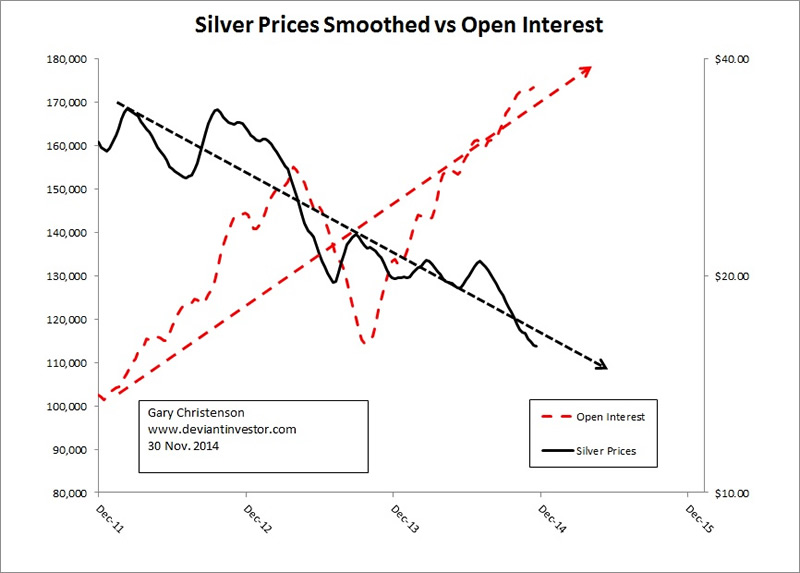
Now graph price and open interest (below) from December 2011 through November 2014. It looks rather different. Excel calculated the statistical correlation at – 0.59. Generally speaking, the correlation between open interest and price reversed at the open interest low on 12/06/2011, which was quite close to the weekly price low at 12/30/2011.

What changed? I don’t know, but some possibilities are:
- A large buyer has aggressively added to futures contracts in the last several years and has remained long instead of selling and accepting losses as prices dropped.
- There was clear recognition that massive debt, bond monetization, QE, and “Operation Twist” would eventually devalue all currencies so consequently “big money” began moving into silver futures as an alternative.
- Germany requested the return (a few months later) of her gold from the NY Federal Reserve which encouraged insiders to buy silver futures.
- High Frequency Trading and market manipulation which attempted to suppress the prices for gold and silver, levitate the S&P, and sell the “economic recovery” story caused the anomaly.
- Something else.
Bill Holter has speculated that the Chinese, or their agents, have been buying silver contracts even as prices declined, in contrast to normal “trader” behavior.
If you have a good theory for what appears to be a clear anomaly, then please respond with a comment. In the meantime it looks like strange market behavior – perhaps one more example of the dominance of High Frequency Trading over human decision making.
Thought: Open interest is roughly 175,000 contracts, which is about 875,000,000 ounces of paper silver. At market price that is about $13 Billion, or only about 15% of what the Fed created each month during QE3. It would take very little digital currency, relatively speaking, to buy all the open interest, or to crush prices via naked sales of paper contracts. Stacks of physical silver are much safer and far more “real.”
GE Christenson aka Deviant Investor If you would like to be updated on new blog posts, please subscribe to my RSS Feed or e-mail
© 2014 Copyright Deviant Investor - All Rights Reserved Disclaimer: The above is a matter of opinion provided for general information purposes only and is not intended as investment advice. Information and analysis above are derived from sources and utilising methods believed to be reliable, but we cannot accept responsibility for any losses you may incur as a result of this analysis. Individuals should consult with their personal financial advisors.
© 2005-2022 http://www.MarketOracle.co.uk - The Market Oracle is a FREE Daily Financial Markets Analysis & Forecasting online publication.


