


US Dollar Index and Crude Oil Analysis
Currencies / US Dollar Nov 30, 2014 - 12:40 PM GMTBy: Austin_Galt

 US Dollar Index
The US dollar has surged in recent months breaking some obvious resistance levels. This has brought out many calls for an even bigger move up. While this is possible, I suspect a big fake out move is in play. Let's investigate.
Firstly, let's begin with the yearly chart of the US dollar index to help put things in perspective.
US Dollar Yearly Chart
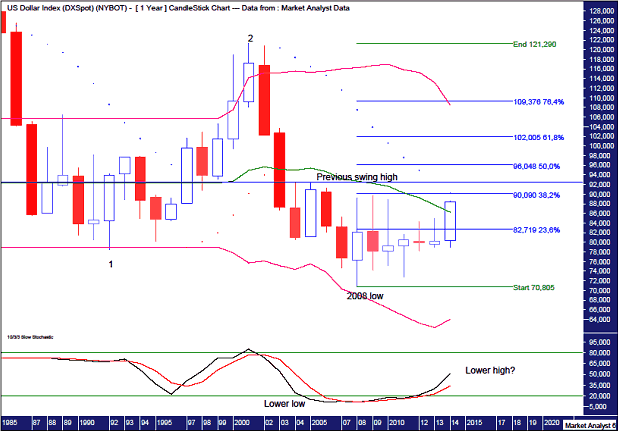
This chart goes back 30 years and is evidence of a massive bear market in play with a pattern of lower lows and lower highs.
I have added some simple Elliott Wave annotations to provide some structure. The all time high was around 165 and I am viewing the 1992 low as the end of wave 1 and the 2001 high as the end of wave 2.
This implies we are in the midst of the destructive wave 3 which should see much more devastation in the value of the US dollar. Americans wanting to visit foreign countries may want to do so pronto before their currency makes it too expensive for them.
The previous major low was set in 2008 and six years later price has still not been able to take out the high price of the same year. This is an indication of weakness and is consistent with price action in a bear trend.
I have added Fibonacci retracement levels of the move down from the 2001 high to 2008 low and so far price has only been able to rally back to just under the 38.2% level. Price turning back down here will be further evidence of the strength of the bear trend.
I have added the Parabolic Stop and Reverse (PSAR) indicator which pertains to the dots. This is currently resistance with the dots overhead at 90.37. I expect this to hold this move up however there is a chance that price busts these dots in a little fake out move. How will we know whether it is a fake out move or not?
I have drawn a horizontal line denoting the previous major swing high set in 2005 at 92.53. Price breaking out above there will most likely mean that a more substantial move higher is playing out. While certainly possible I doubt that scenario.
The Stochastic indicator is trending up but already has a lower low in place and a potential lower high forming now will add credibility to the big bear trend.
The Bollinger Bands show price is hovering around the middle band which is a common place for price to turn back down. Price breaking above the previous major swing high would most likely see price head to the upper band.
Let's move on to the monthly chart.
US Dollar Monthly Chart
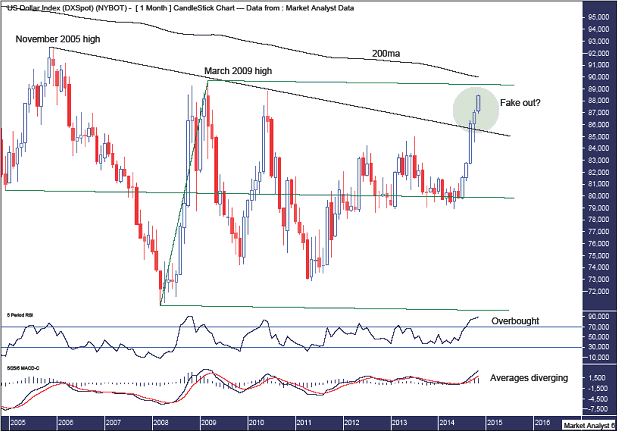
I have drawn a black down-trending line across the highs of November 2005 and March 2009. Price has recently broken out above this trend line which has seen calls for an even bigger move up reach fever pitch. However, this trend line has been very obvious so I think it is suspect.
In fact, I believe the move above this trend line is a fake out move that will shortly see price turn back down and resume the overall downtrend. This can be seen in the green highlighted circle.
So where is this move higher likely to end?
I have drawn an Andrew's Pitchfork with the upper pitchfork trend line originating from the March 2009 high at 89.71. I suspect price will top out around this level and essentially make a bearish double top with the trend.
Also, the 200 period moving average is just above the top pitchfork trend line and this should also act as resistance.
The Relative Strength Indicator (RSI) is in overbought territory so a pullback at the least could be expected shortly.
Also, the Moving Average Convergence Divergence (MACD) indicator shows the averages have diverged quite a lot so some regression to the mean in the form of a move down looks in order.
US Dollar Weekly Chart
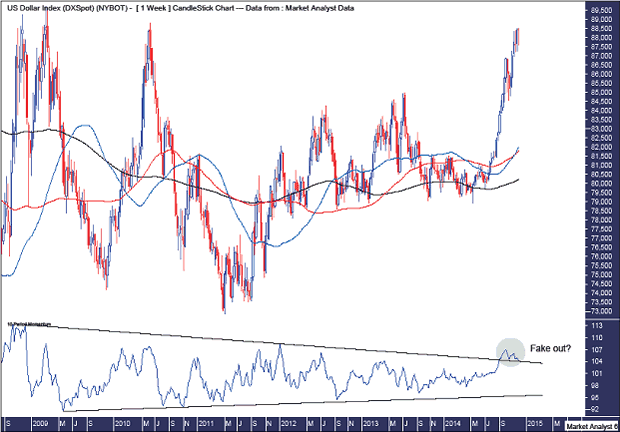
I have added moving averages with time periods of 50 (blue), 100 (red) and 200 (black) and we can see they have been criss-crossing each other since early 2009. This is evidence of the massive consolidation that has been taking place in recent years.
The longer the consolidation takes, the bigger the next move will be. It appears as if we are now in the end game of this consolidation and price has moved to the upside.
Now keep in mind it is the market's intention to try and deceive us at every turn and I believe we are smack bang in the middle of another great market deception.
Just imagine you are playing rugby and your opponent is running straight for you with ball in hand. At the last moment, as you are about to go in for the tackle, your opponent feigns to go right but steps off the right leg back on to the left leg and darts away down the left side.
This is what I think is happening with the US dollar index right now. Price is feigning to go up but this is the fake out move before it turns back down and darts away with the bulls left holding the bag and the bears in desperate pursuit as they try to get set.
I have added a Momentum indicator which shows this fake out move that I believe is in play. I have drawn both down-trending and up-trending lines which show the consolidation phase was running out of puff and nearing its end.
The first move above whichever trend line would be the fake out move before the market's real intentions are revealed. If price busted the lower trend line first then a substantial move up could be expected. However, the first move has been to bust above the upper trend line so it is my opinion that the market's real intention is to be a big move down. This is shown in the green highlighted circle.
And as always, time will be the judge.
Oil
The price of oil has capitulated going into the end of November after the OPEC sheiks said they weren't going to cut supply in the face of declining prices. These capitulation moves are often found at major low points and I suspect just that with the oil price.
Let's examine the situation using the daily and monthly charts.
Oil Daily Chart
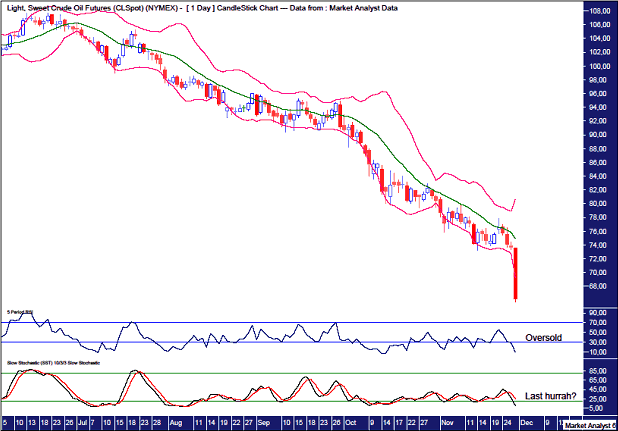
I was expecting price to rally before trading down below US$70 to put in a major low in 2015. But here we are and it is my opinion that the final pullback low is imminent.
I'm used to being patient as I wait for my longer term targets to be hit. Sometimes when I expect a target low is about to be hit price reverses higher and I am forced to wait as price goes through the motions. In this case I was expecting a rally before my target was hit but instead oil is gunning for it now. Perhaps this is an early Christmas present from Santa as a reward for being patient in other instruments I follow!
The Bollinger Bands show price being turned back at the middle band and testing the low before the OPEC news hit.
The Relative Strength Indicator (RSI) is very oversold as is the Stochastic indicator which looks like this could be the "last hurrah" move.
To get a better idea of where the final low might be, let's move on to the monthly chart.
Oil Monthly Chart
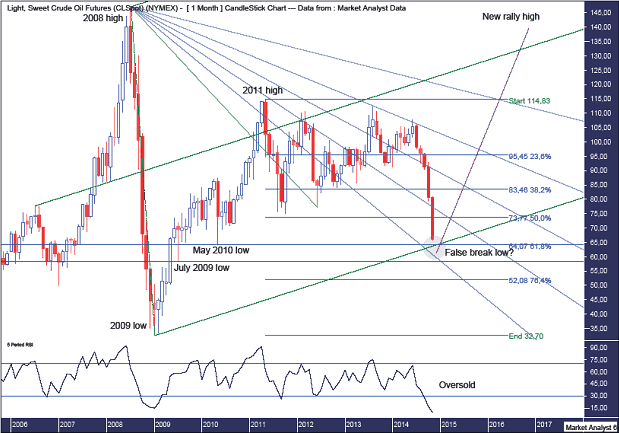
The RSI is at an oversold level as was last seen at the 2009 low. I generally like to see bullish divergences at lows but sometimes lows are accompanied by extreme readings or outliers and this seems to be the case with oil. Most major tops and bottoms on this chart have not been accompanied by bullish divergences. Just look at the 2008 high, 2009 low and 2011 high as evidence of that.
I have drawn an Andrew's Pitchfork and I am looking for price to find support around the lower pitchfork trend line. Interestingly, this trend line looks about to intersect with the May 2010 low support level which stands at US$64.24.
Originally, I was looking for the final pullback low to pull up just short of the May 2010 low level. It still might, however considering price is down here now I suspect price may dip a touch below that level and set up of false break low. This can be seen in the green highlighted circle.
I have added a Fibonacci Fan which seems to show some symmetry with price. The most recent two highs were rejected at the 61.8% angle. I am looking for price to now find support at the 23.6% angle which can also be seen in the green highlighted circle.
Also, I have added Fibonacci retracement levels of the move up from the 2009 low to 2011 high. The 61.8% level stands at US$64.07 and is right around the May 2010 low level. Now the 61.8% level is one of the most popular Fibonacci levels so it is obvious to many technicians. I often find price dips a bit below this level which is the market's way of attempting to fake out these technicians. I suspect this will apply here.
I doubt price will go below the July 2009 low which stands at US$58.32. The 76.4% Fibonacci level is at US$52.08 but I just don't see price trading that low.
So essentially I am now looking for the final pullback low to be set in early December around the US$62 level.
Once this low is in place I expect a rally and then a higher low to be set in the first half of 2015. After that I'll be looking for a big move up above the 2011 high which stands at US$114.83.
So, there still looks to be some further downside in store and I'm certainly not getting in front of this southbound freight train yet. I will put out some daily chart analysis for subscribers when I like the pattern for low. This is a big play long opportunity that I will be looking to get involved in.
By Austin Galt
Austin Galt is The Voodoo Analyst. I have studied charts for over 20 years and am currently a private trader. Several years ago I worked as a licensed advisor with a well known Australian stock broker. While there was an abundance of fundamental analysts, there seemed to be a dearth of technical analysts. My aim here is to provide my view of technical analysis that is both intriguing and misunderstood by many. I like to refer to it as the black magic of stock market analysis.
© 2014 Copyright The Voodoo Analyst - All Rights Reserved
Disclaimer: The above is a matter of opinion provided for general information purposes only and is not intended as investment advice. Information and analysis above are derived from sources and utilising methods believed to be reliable, but we cannot accept responsibility for any losses you may incur as a result of this analysis. Individuals should consult with their personal financial advisors.
© 2005-2022 http://www.MarketOracle.co.uk - The Market Oracle is a FREE Daily Financial Markets Analysis & Forecasting online publication.